In today’s data-driven world, poor data quality often results in misleading insights, flawed machine learning models, and costly business decisions. Healthcare, finance, and other industries face challenges such as manual entry errors, inconsistent integrations, and massive data volumes that make manual checks impractical. Traditional retrospective monitoring often fails to identify issues early, leading to compliance risks and operational inefficiencies. Databricks DQX solves this by embedding proactive, scalable data quality checks into PySpark workflows, ensuring reliable, rule-compliant data for analytics and decision-making.
What is Databricks DQX?
Databricks has launched an effective, yet straightforward Python validation framework designed to evaluate the data quality of PySpark DataFrames. The DQX framework facilitates real-time quality validation throughout the data processing phase, moving away from the traditional method of only monitoring after the fact.
In contrast to conventional approaches that typically rely on retrospective monitoring, Databricks DQX is engineered to proactively assess data quality at scale, applicable to both batch and streaming data. By embedding data quality checks directly into your PySpark workloads, you can identify errors early and guarantee that only the correct data progresses to downstream layers.
Utilization of DQX Within the Lakehouse Architecture
Ensuring data quality in modern architectures requires a structured, proactive approach—and Databricks DQX delivers exactly that. The journey begins at the bronze layer, where raw data enters the pipeline and undergoes comprehensive profiling through DQX Profiler. This critical step reveals the structural and quality characteristics, allowing for the definition of precise rules for uniqueness, completeness, and validity. As data transitions to the silver layer, these rules are enforced through rigorous checks. Records that fail are quarantined for remediation—either manually or automatically—and then reintegrated via a curated dataset to maintain integrity. A second validation at the silver level ensures that cleansing and enrichment have not introduced new errors, thereby preparing the data for business use. Finally, only data that meets all quality standards is advanced to the gold layer, which is optimized for analytics, reporting, and machine learning. Closing the loop, DQX integrates findings—errors, warnings, and trends—into a dynamic dashboard, transforming quality monitoring into a continuous, strategic capability.
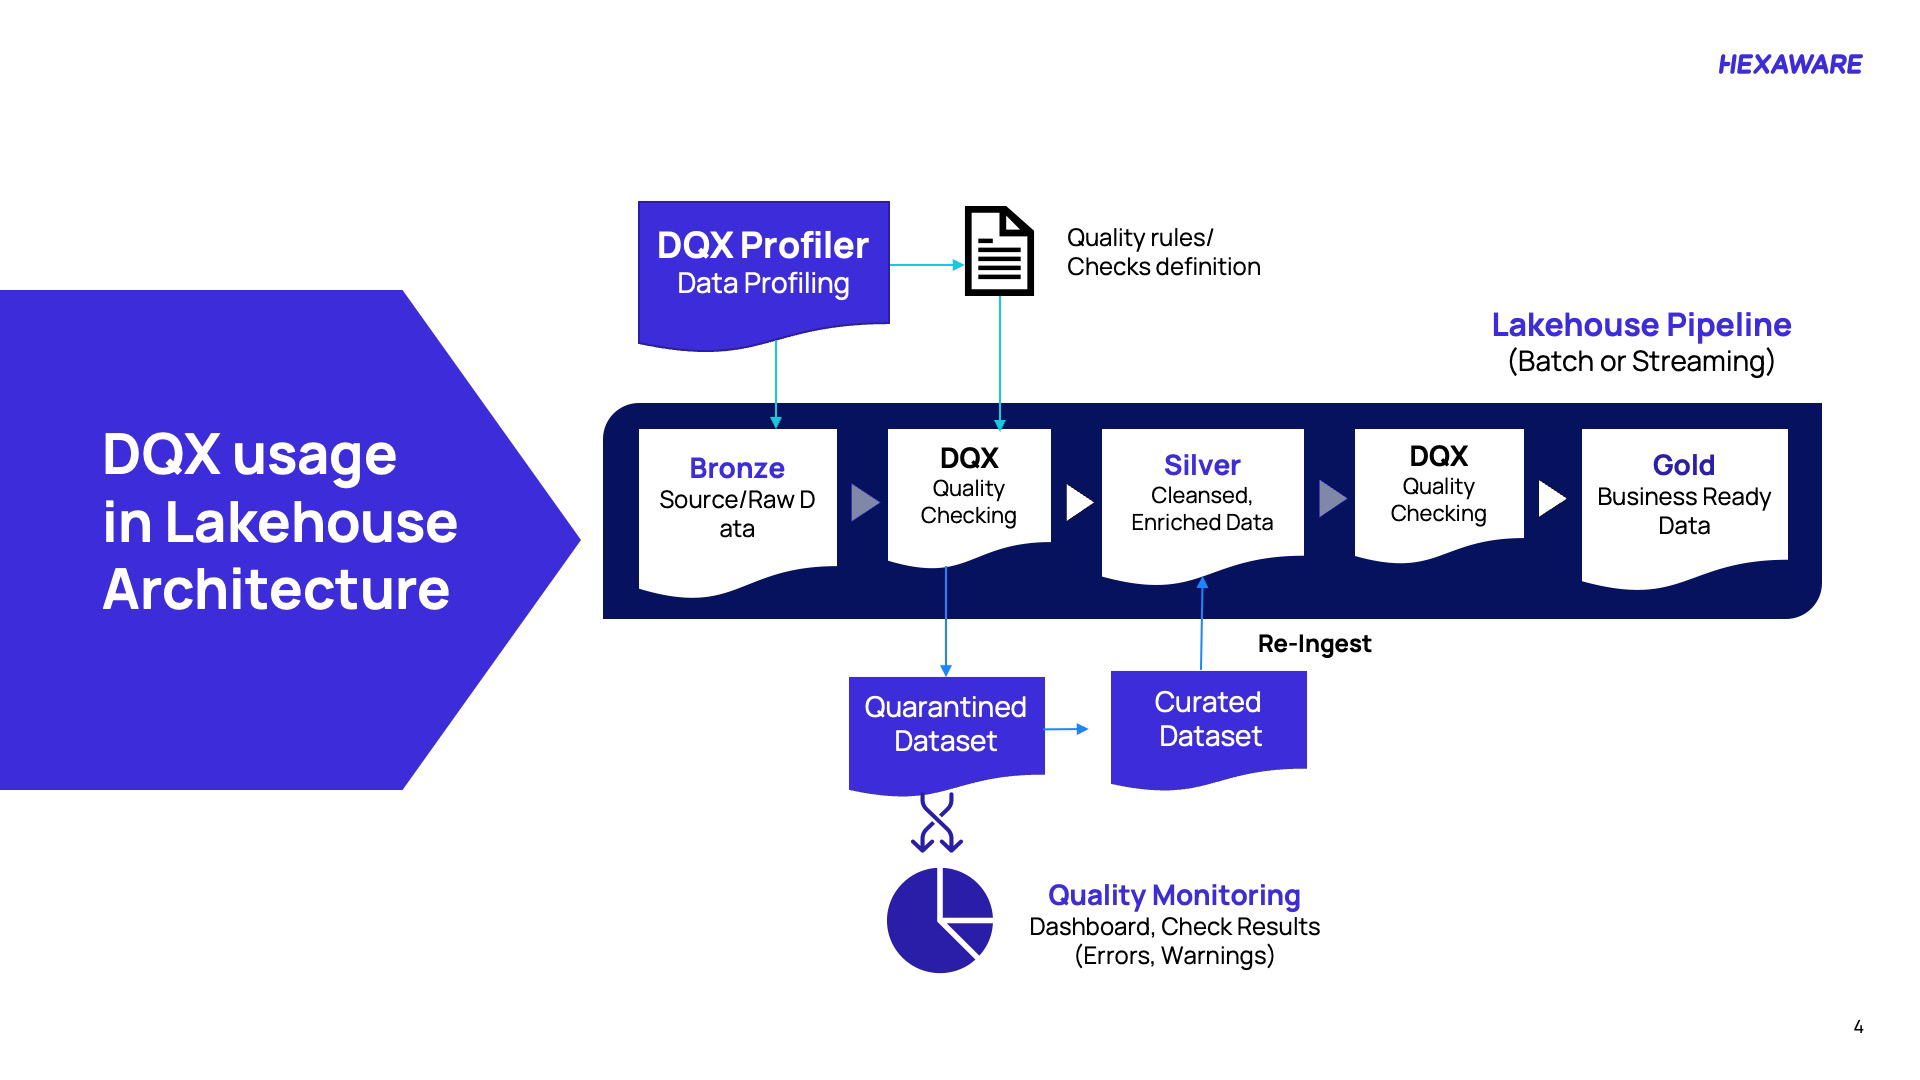
Picture 1: DQX usage in Lakehouse architecture
Here’s a step-wise breakdown of DQX’s usage in Lakehouse architecture:
- Profile raw data early: DQX Profiler analyzes source data at the bronze layer to uncover structure and quality gaps, enabling precise rule definition.
- Enforce quality standards: Apply constraints like uniqueness, completeness, and validity during the silver layer transition to prevent downstream errors.
- Quarantine and remediate: Non-compliant records are isolated for manual or automated correction, then reintegrated via curated datasets.
- Validate enrichment accuracy: A second check at silver ensures cleansing processes haven’t introduced new issues.
- Deliver business-ready data: Only fully compliant data advances to the gold layer for analytics, reporting, and AI.
- Monitor continuously: Dashboards consolidate errors, warnings, and trends, transforming quality checks into strategic insights.
Key DQX Capabilities
DQX delivers actionable data quality at scale, explaining why checks fail, working agnostically with PySpark DataFrames, and supporting both batch and structured streaming. It integrates with Lakeflow/DLT, enables custom reactions (drop, mark, quarantine), and applies warning/error levels for nuanced handling. Rules operate at row and column granularity. Automated profiling accelerates rule generation, while dashboards consolidate errors and warnings into ongoing insights—turning quality control into a continuous, strategic capability for business-ready data.
| Capabilities |
Description |
| Info of Failed Checks |
DQX provides detailed insight into why a data quality check failed. |
|
Data Format Agnostic |
DQX works with PySpark DataFrames, making it usable regardless of input data formats. |
|
Spark Batch & Structured Streaming Support
|
It supports both batch data processing and structured streaming. |
|
Lakeflow / DLT Integration
|
DQX integrates with Databricks Lakeflow pipelines to enforce data quality within those pipelines. Visit for details on DLT integration. |
|
Custom Reactions to Failed Checks
|
DQX can drop, mark, or quarantine invalid data flexibly. |
| Check Levels (Warning / Error) |
Users can classify checks as warnings or errors, enabling a more nuanced approach to handling data quality violations. |
|
Row & Column Level Rules |
Define quality rules at either the row level (entire row validity) or column level (individual field constraints), depending on needs. Visit for details on quality checks. |
|
Profiling & Rule Generation
|
Automatically profile the input data to help suggest candidate quality rules. Visit for more details on profiling and quality checks generation.
|
Table 1: Key DQX capabilities
Sample Dataset
Healthcare is a critical focus area because of its profound impact on patient outcomes, operational efficiency, and regulatory compliance. By leveraging high-quality data, organizations can gain valuable insights into treatment effectiveness, medication interactions, and diagnostic trends, ultimately enhancing patient care. Accurate data also drives operational excellence by identifying bottlenecks in admissions, optimizing hospital stays, and ensuring resource utilization across providers. From a financial perspective, robust data analytics enables better expense management and supports value-based care through detailed analysis of billing patterns, insurance impacts, and cost drivers. Furthermore, healthcare data fuels innovation, powering clinical trials, predictive models such as risk stratification, and personalized medicine strategies built on integrated clinical and administrative information. Finally, strong data governance ensures adherence to regulatory standards, helping institutions track quality metrics, meet reporting obligations, and maintain compliance in an increasingly complex healthcare landscape.
Patient Healthcare Dataset
Taking an example from Kaggle, this contains 55,500 patient records across 15 attributes, capturing demographic, medical, and administrative details. It includes fields such as patient name, age, gender, blood type, and medical condition, along with hospitalization details like doctor, hospital, date of admission, admission type, and discharge date. Financial data, such as billing amount and insurance provider, is also included. Additionally, medication and test results columns provide clinical insights into patient treatments and outcomes. Overall, the dataset supports analysis of patient demographics, hospital operations, and healthcare trends.
Data Quality Challenges in Patient Healthcare Datasets
In healthcare, patient datasets such as electronic health records (EHRs) containing details like admission/discharge dates, billing amounts, patient names, ages, and hospital information are foundational for clinical decision-making, regulatory compliance (e.g., HIPAA), billing accuracy, and analytics (e.g., population health trends or predictive modeling). However, these datasets often suffer from inherent quality issues due to:
- Data Entry Errors: Manual input by overworked staff leads to invalid formats (e.g., malformed dates like “2023-13-45” for admission_date) or missing values (e.g., null patient names).
- Integration Inconsistencies: Data from disparate sources (e.g., hospitals, labs, insurers) may use varying formats, ranges, or vocabularies, resulting in mismatches (e.g., age outside realistic bounds, such as negative values or discharge_date before admission_date).
- Scale and Velocity: Healthcare generates massive volumes of data daily (e.g., millions of records across various systems), making manual quality checks infeasible and amplifying the risk of downstream issues, such as faulty AI models or erroneous reimbursements.
- Business Impact: Poor data quality can result in denied claims (costing billions annually), misdiagnoses, compliance fines, or biased analytics—exacerbating inequities in patient care. The core problem is detecting, quantifying, and remediating these issues at scale without disrupting workflows, especially in a regulated environment where auditability is paramount.
Profiling and Quality Checks Generation
Data profiling can be run to profile input data and generate quality rule candidates with summary statistics. The generated data quality rules (checks) can be used as input for the quality checking as described here. In addition, the Lakeflow (DLT) generator can generate native Lakeflow Pipelines expectations. Initiated ws_client is an instance of WorkspaceClient class, and we use it to call methods and access functionality provided by WorkspaceClient in the DQX framework. Define a function profile_data that takes a DataFrame (finalDf) as an input and calls the profile method on finalDf, which returns summary statistics and profiles. It returns two values, summary statistics, and profiles.
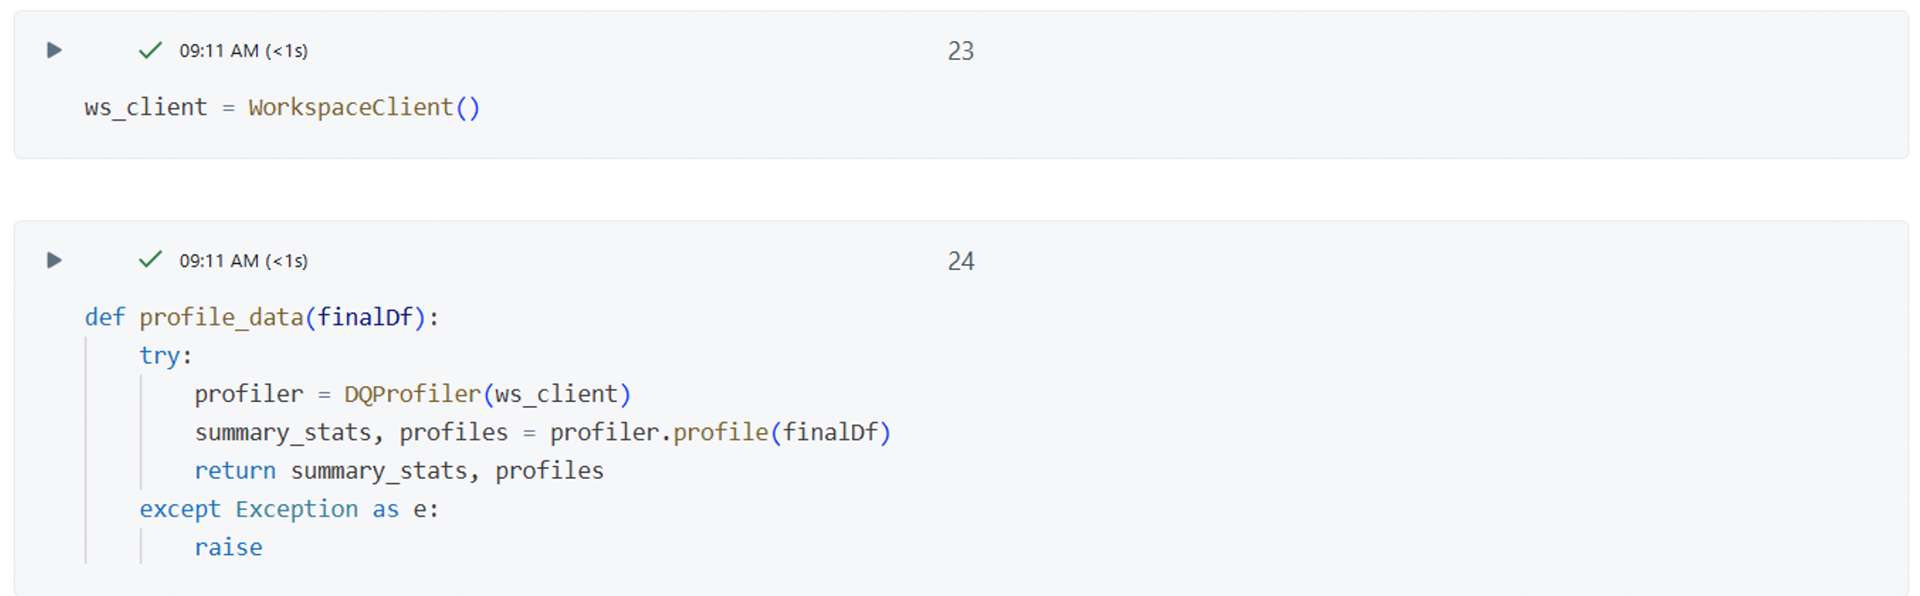
Picture 2: WorkspaceClient in DQX framework
Defining Quality Rules (Checks)
Quality rules can be specified in several formats:
- YAML or JSON file (declarative approach), suitable when applying checks programmatically and using DQX workflows. Refer to the Quality Checks Storage Guide for further information.
- Delta table (most scalable), suitable when applying checks programmatically and using DQX workflows.
- Programmatically as an array of DQRule objects.
Checks can be saved and loaded from various storage systems as described here. The loaded checks can be applied to the data using methods as described here.
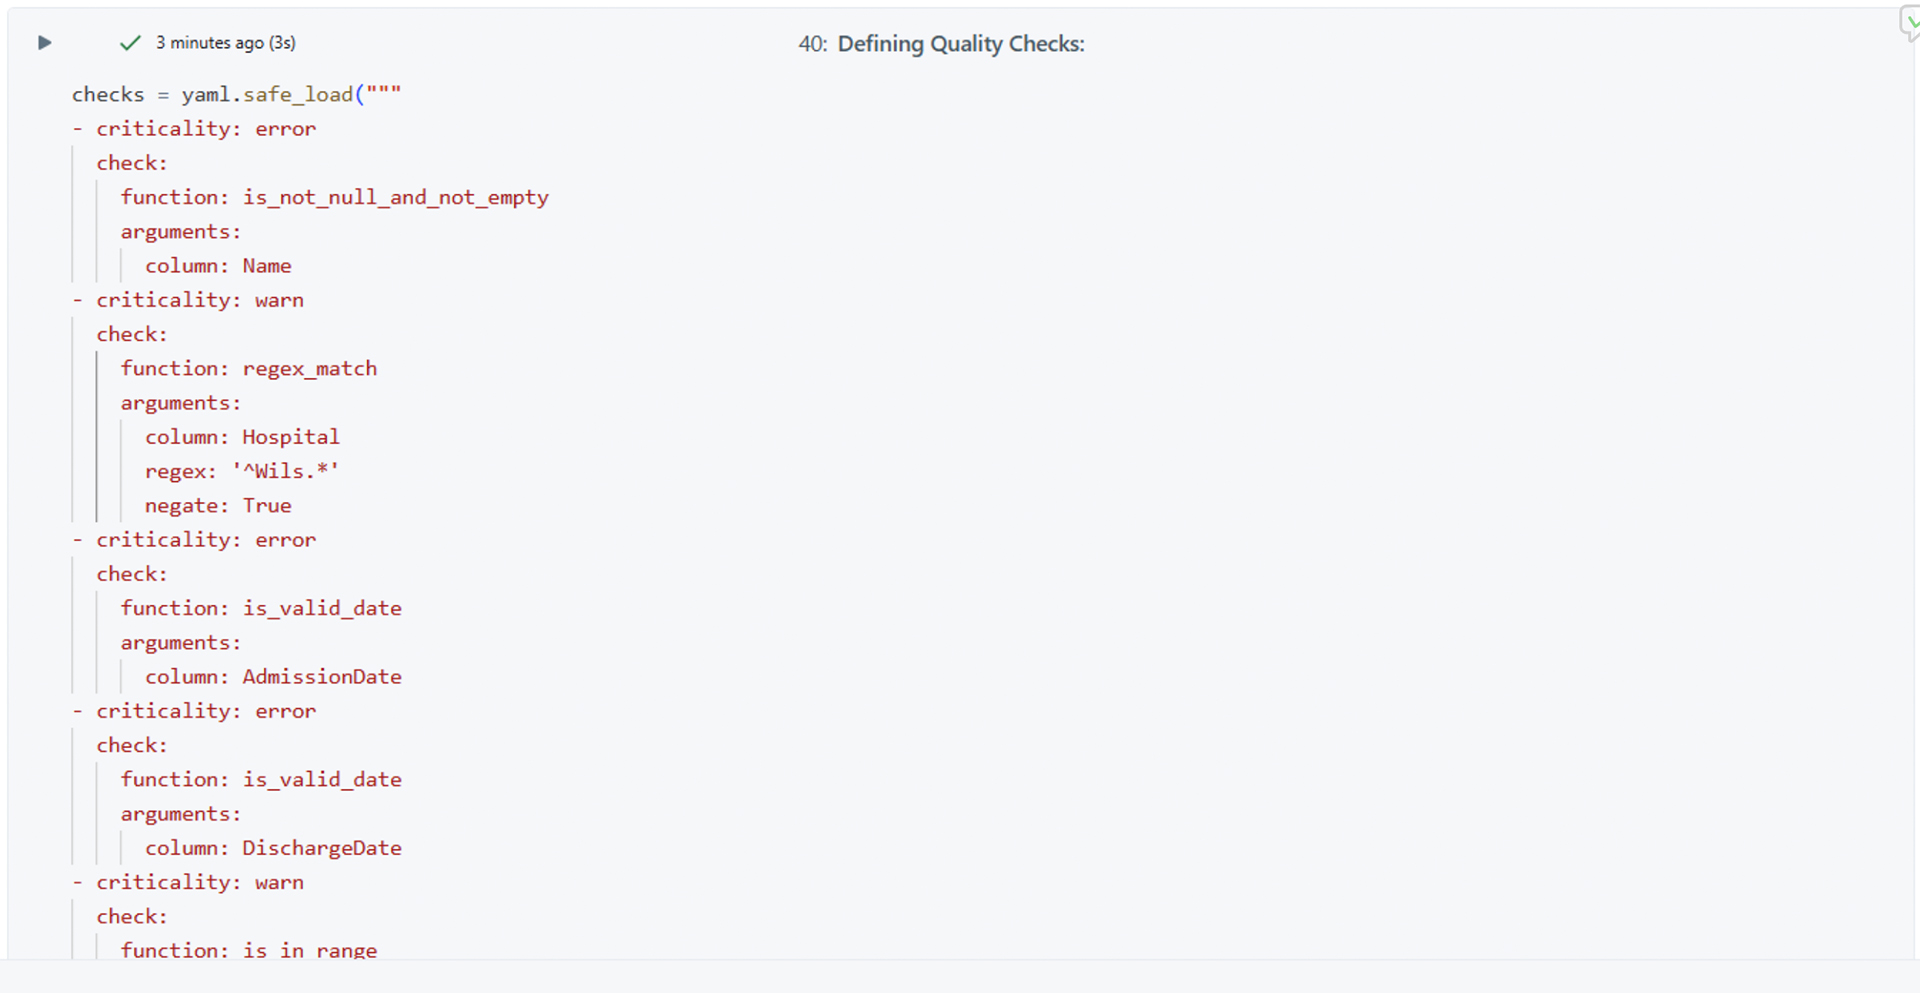
Picture 3: Defining quality checks
Validating the Syntax of Quality Checks
You can validate the syntax of checks loaded from a storage system or checks defined programmatically before applying them. This validation ensures that the checks are correctly defined and can be interpreted by the DQX engine.

Picture 4: Validating the syntax of quality checks
The code shared in picture 4 validates the custom data quality checks defined in checks using DQEngine. It asserts that there are no validation errors in the checks. If validation passes, it initializes a new DQEngine instance with a WorkspaceClient.
Applying Quality Checks
Checks can be applied to the input data by one of the following methods of the DQEngine class:
For checks defined with DQX classes:
- apply_checks: apply quality checks to a DataFrame and report issues as additional columns.
- apply_checks_and_split: apply quality checks and split the input DataFrame into valid and invalid (quarantined) DataFrames.
- apply_checks_and_save_in_table: an end-to-end approach to apply quality checks to a table and save results to the output table(s) via a single method call.
For checks defined as metadata (list of dictionaries, or loaded from a storage):
- apply_checks_by_metadata: apply quality checks to a DataFrame and report issues as additional columns.
- apply_checks_by_metadata_and_split: apply quality checks and split the input DataFrame into valid and invalid (quarantined) DataFrames.
- apply_checks_by_metadata_and_save_in_table: end-to-end approach to apply quality checks to a table and save results to output table(s) via a single method call.

Picture 5: Checks defined as metadata
The code shared in picture 5 applies data quality checks defined in checks to the DataFrame finaDf using the dq_engine instance. It then splits the data into two DataFrames:
- silver_df: contains the rows that passed the quality checks (valid data).
- quarantine_df: contains the rows that failed the quality checks (quarantined or invalid data).
We define a set of data quality rules, validate them, and then use a data quality engine to apply these rules to your data, splitting it into “clean” and “quarantined” sets based on the results.
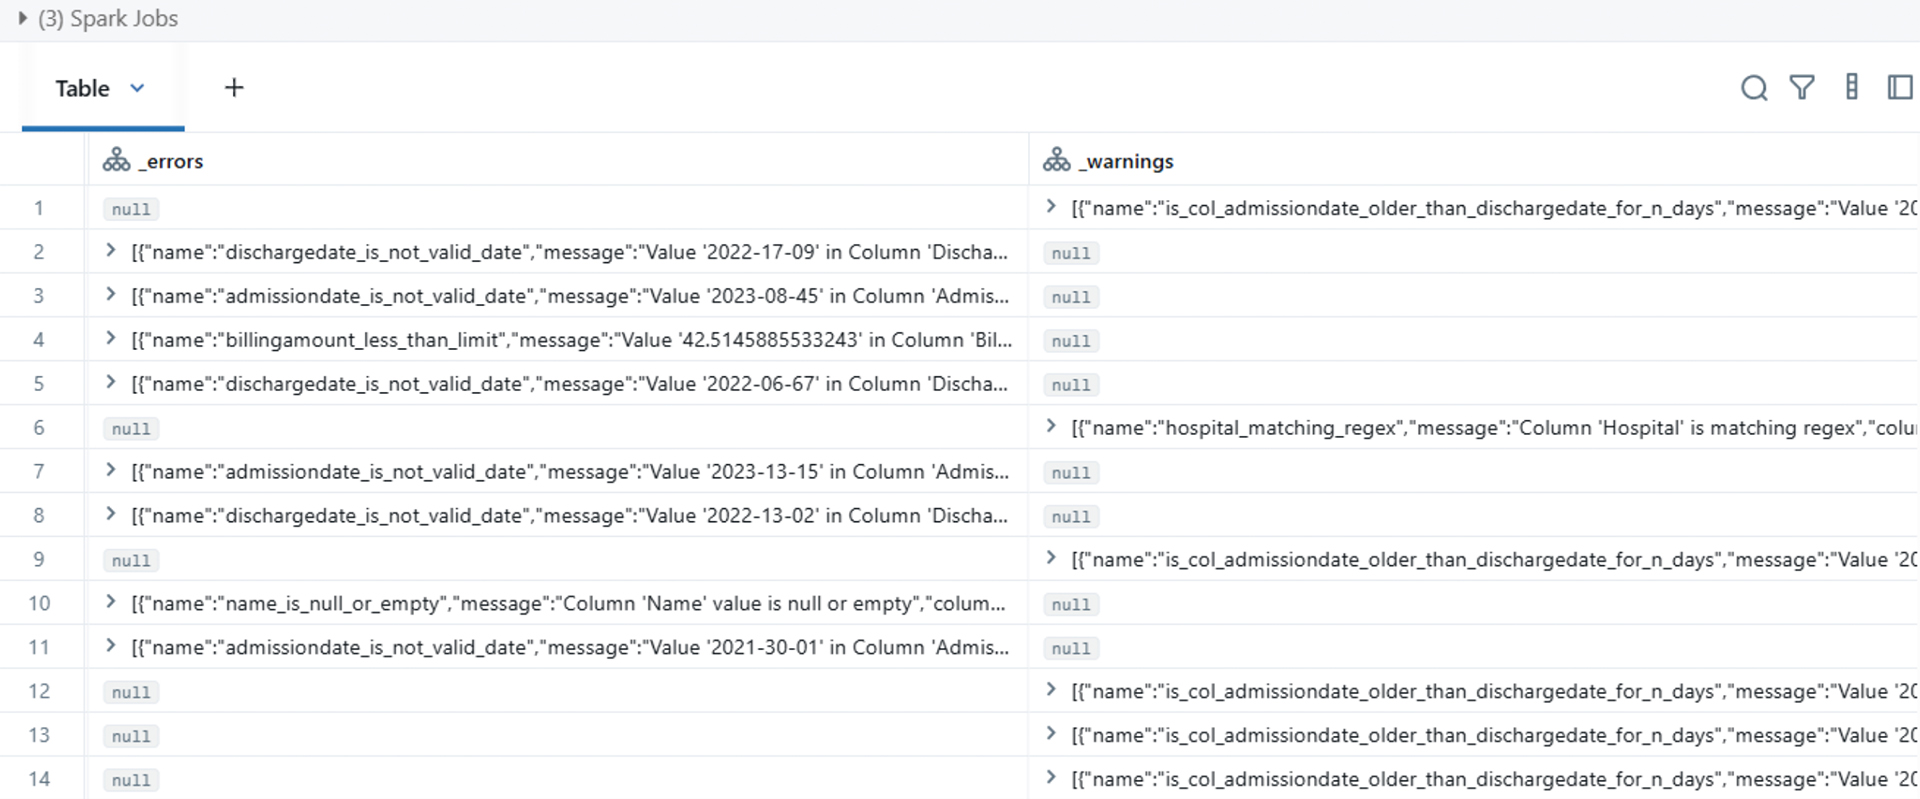
Picture 6: Quarantine Dataframe
This quarantine data frame provides a detailed listing of data quality issues found in a hospital/patient dataset using Spark Jobs. It highlights several types of errors:
- Invalid admission and discharge dates, with examples like “2022-17-09” or “2023-08-45,” which are not valid for calendar dates.
- Cases where admission dates are not logically consistent with discharge dates (e.g., admission date older than discharge date by an unexpected number of days).
- Billing amounts flagged for being less than a given limit.
- Instances where the hospital column matches certain regex patterns, possibly indicating incorrect or unexpected values.
- Null or empty values found in the ‘Name’ column, indicating missing patient names.
Overall, the Quarantine Dataframe is a data validation report helping to pinpoint incorrect, missing, or inconsistent data entries in patient hospital records for correction or further investigation.
Quality Checking Results
Output Summary: Extracted Errors and Warnings
The output table, as showcased in picture 7, contains two additional main columns: _errors and _warnings. The _errors column lists records that failed validation checks, such as invalid date formats (admissiondate_is_not_valid_date, dischargedate_is_not_valid_date), missing names, or billing amount issues. The warnings column highlights potential data quality concerns, such as admission dates older than discharge dates or pattern mismatches in hospital names. Overall, it represents results from a data quality framework (e.g., Databricks DQX) capturing rule-based validation outcomes for each record.
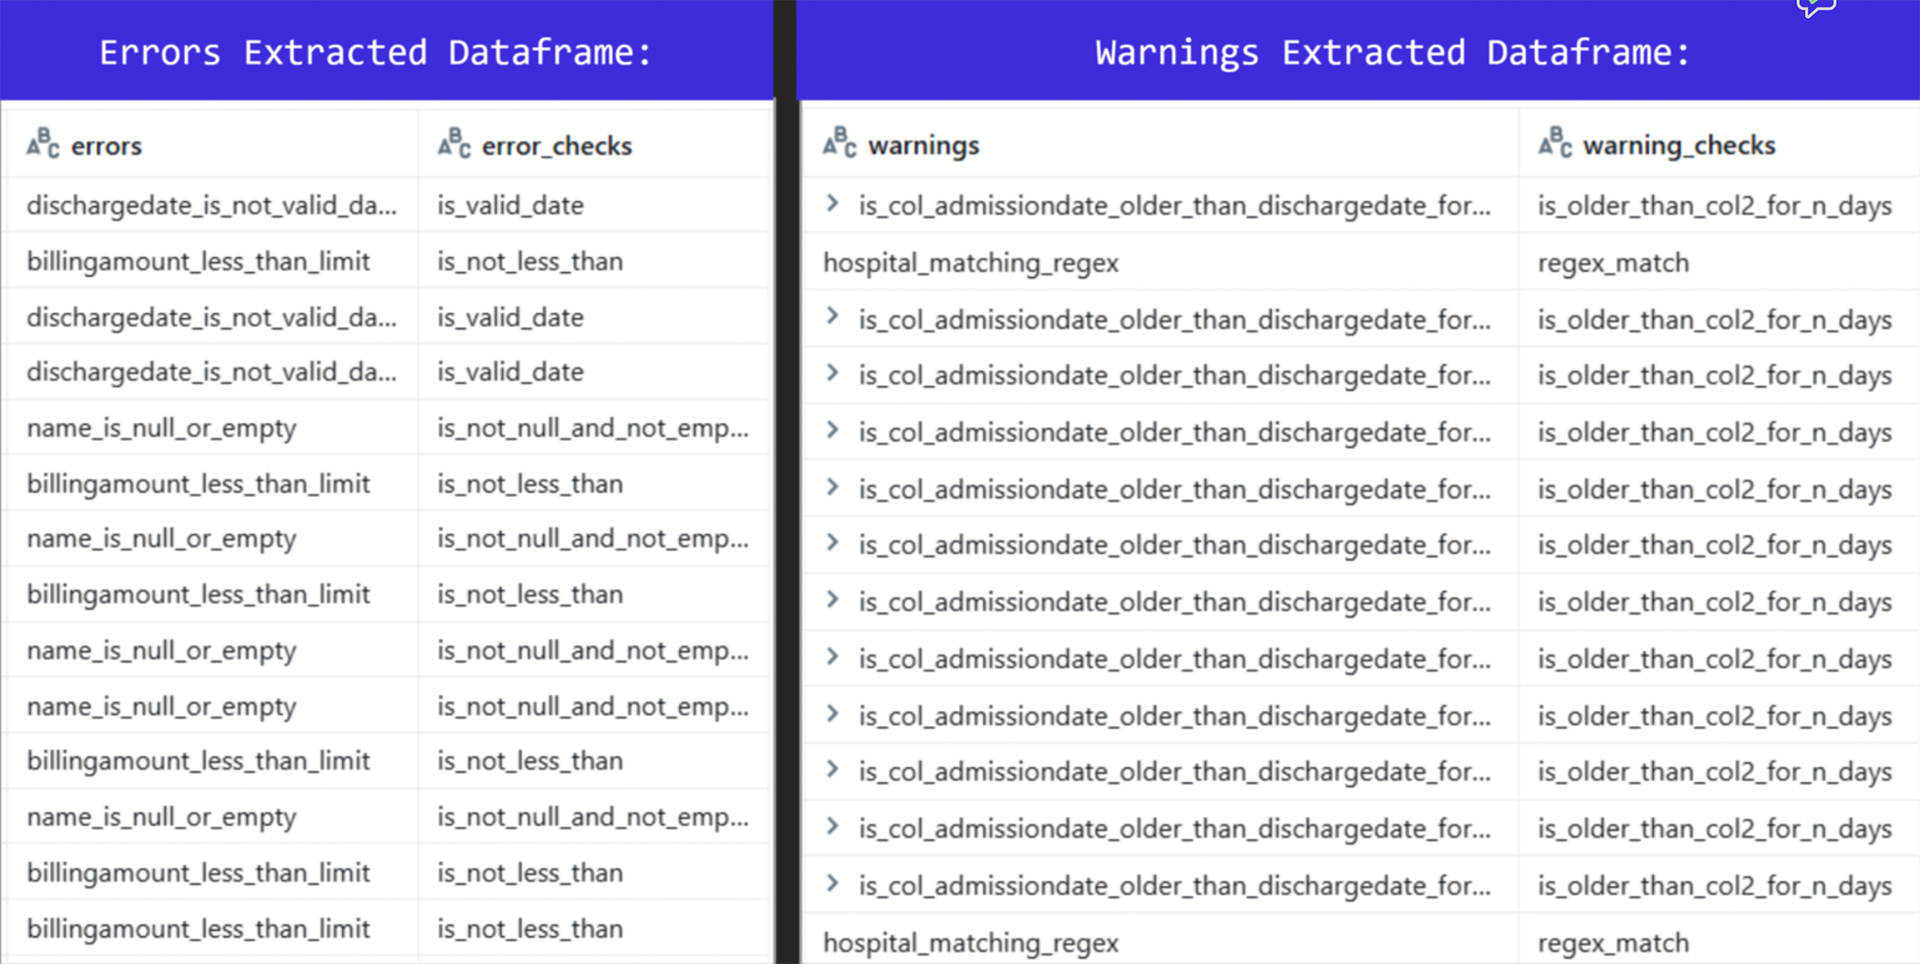
Picture 7: Output summary of extracted errors and warnings
DQX Data Quality Dashboard
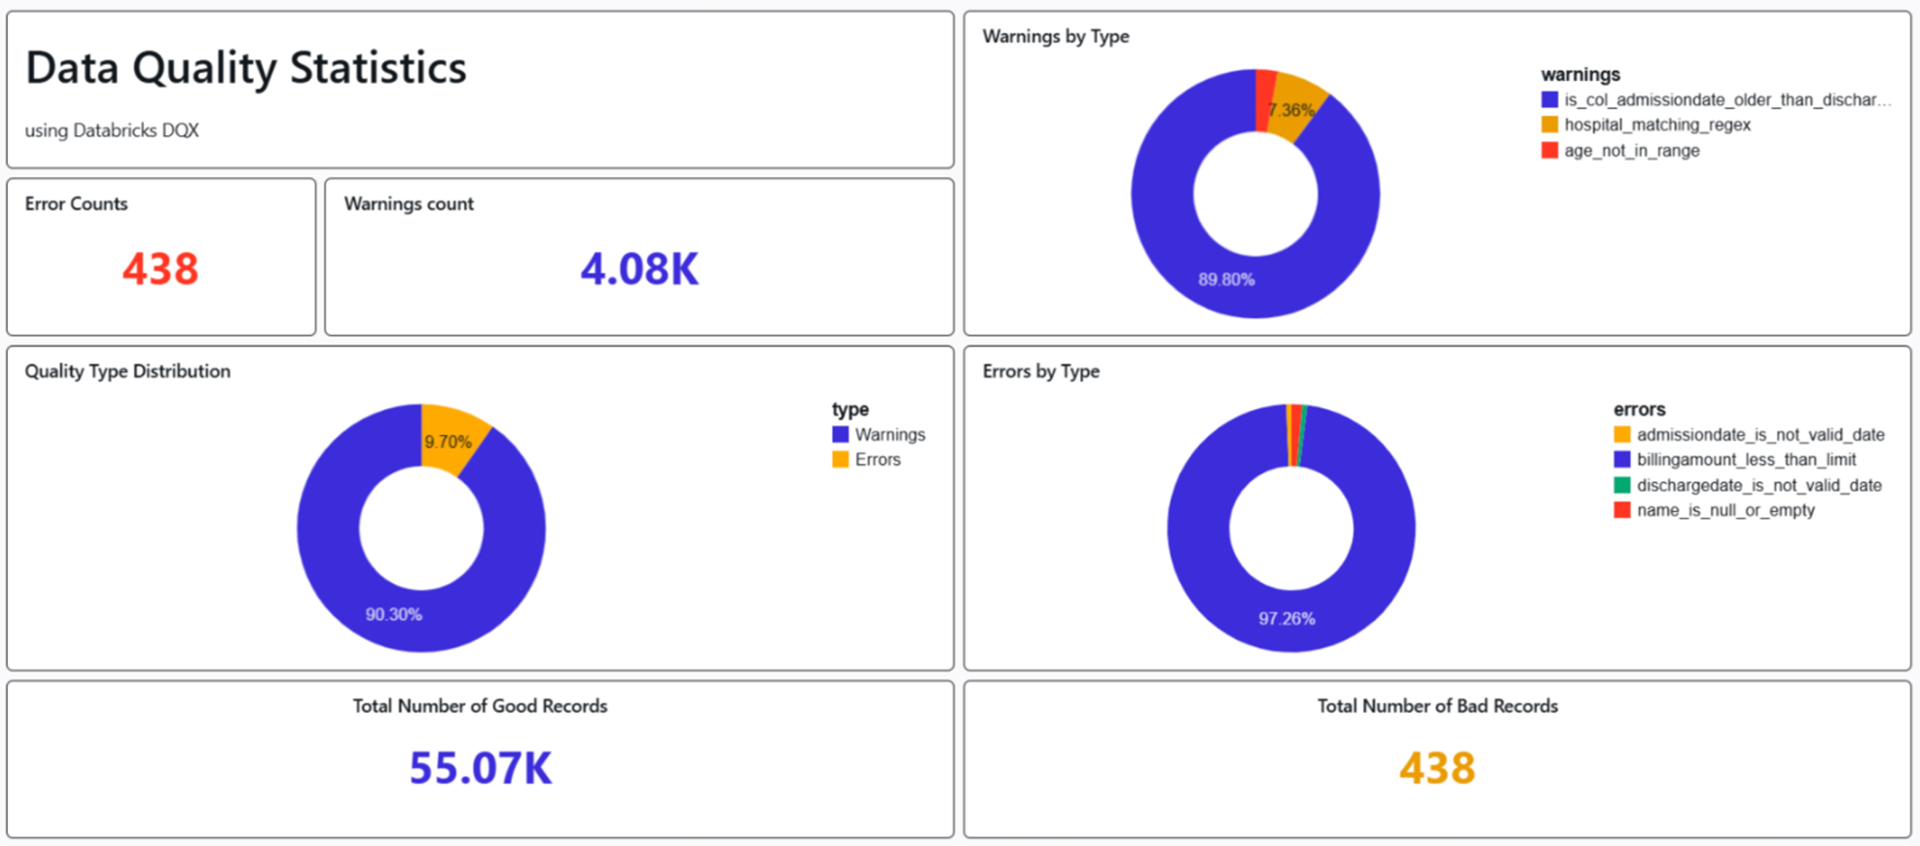
Picture 9: Snippets from Databricks Dashboard
Dashboard provides a high-level snapshot of data quality across the patient’s dataset. Overall, the dataset shows strong quality (99.2% good records), but warning signals for opportunities for refinement. 55.07K (90.3% of total) of good records are clean, rule-compliant rows ready for analysis. 438 (0.8%) Bad Records are primarily errors; these are quarantined or require remediation. In the pie chart insight (Quality Type Distribution), the Blue slice (90%) represents warnings-dominated “acceptable” records, and the orange slice (9%) highlights error-impacted ones. In Pie Chart Insight (Warnings by Type): Admission date older than discharge date (Blue slice, ~89.80%), checks reversal (admission date > discharge date) indicates a data error or inconsistency, but the dates are still valid formats. This is the most common warning, suggesting a systemic issue in data recording or ETL processes. Hospital not matching regex (Red slice, ~7.36%) validates the hospital name or ID against a predefined regular expression (regex) pattern. Age not in range regex (Red slice, ~3%) ensures the patient’s age field matches a regex for numeric ranges. In Pie Chart Insight (Errors by Type): Admission date & Discharge is not a valid date (Yellow & Green slice, small ~1-2%) validates the admission date field as a proper date format (e.g., YYYY-MM-DD), Invalid formats fail this. Name is null or empty (Red slice, small ~1%) checks for a non-empty patient name field; NULL or blank names violate completeness rules. Billing amount less than limit (Blue slice, ~97%) checks if the billing amount exceeds a minimum threshold.
Conclusion
Ensuring robust data quality in Databricks requires proactive strategies. By embedding data quality checks in Databricks and leveraging PySpark data quality with PySpark data validation, organizations achieve trusted, analytics-ready datasets.
Databricks DQX is a notable open-source framework for data quality that emphasizes automation, scalability, and flexibility in data validation. By integrating effectively with the Databricks Lakehouse Platform, DQX allows teams to efficiently define, execute, and monitor data quality rules across extensive datasets. With its declarative methodology, extensibility, and native support for Delta Lake, Databricks DQX sets a strong foundation for enterprises aiming to achieve data excellence at scale.
To learn more about how Hexaware can help you optimize Databricks for your organization, click here.