Reimagined ITOps is a weekly series about what IT operations becomes when AI stops assisting and starts operating. This is article 7 of Season 1. Stay with it.
Every AI service desk pitch I have sat through ends on the same sentence. The routine work goes to the machine, and the team is freed up for higher-value work.
I have never watched the higher-value work arrive. I have watched the harder work arrive, into a desk that was staffed, measured, and priced for the work that just left.
The desk’s own numbers then tell a story nobody briefed the CIO on. First contact resolution falls. Handle time rises. Cost per ticket climbs. Tickets per analyst drop. Every metric on the wall moves the wrong way in the same quarter the program starts working.
My claim: when the easy work drains out of a service desk, what remains is harder, not higher value, and a desk still measured on volume will report its own success as a failure. Re-measure the desk before the drain begins, or the program gets blamed for exactly what it was built to do.
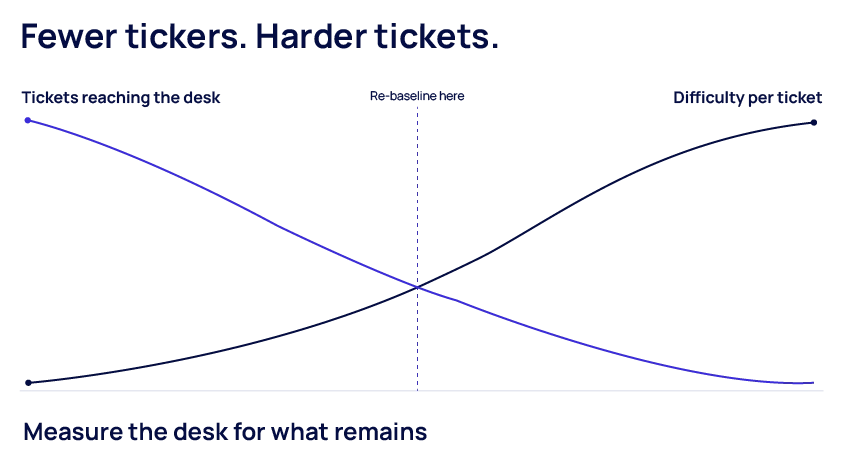
Line chart titled fewer tickets, harder tickets. Two curves over an unlabeled time axis: a teal line labeled tickets reaching the desk falling from upper left to lower right, and a violet line labeled difficulty per ticket rising from lower left to upper right, crossing in the middle. A faint dashed vertical line at the crossing is labeled re-baseline here. Caption: measure the desk for what remains.
The Arithmetic Nobody Puts in the Business Case
The mix shift is pure arithmetic, and it is unforgiving.
Take a desk that handles 10,000 tickets a month, where 6,000 are the quick, convergent kind that close in minutes and 4,000 are the slow kind that take an hour and a second pair of hands. Now remove most of the 6,000, because the end user became the first resolver and the governed path underneath carried them.
The desk is left with roughly 4,000 tickets, almost all of them the slow kind. Average handle time has roughly doubled. First contact resolution has collapsed, because the tickets that used to be resolved on first contact are the ones that left. Cost per ticket is up sharply, while total cost is down. Those are illustrative figures, but the shape is the same in every estate I have looked at.
Industry surveys this year point the same way. A majority of support leaders who deployed automation reported human-handled volume flat or higher the following year, and the tickets-per-analyst benchmark has barely moved in 4 years even as the composition of those tickets shifted toward complexity.
The business case counted the 6,000 as savings. It did not count what the remaining 4,000 cost to handle properly, or what it does to a team that reads its scorecard every Monday.
The Drain Is Uneven, and That Is the Point
The easy work does not drain out evenly across the desk. It drains out by queue, wherever coverage is proven, and nowhere else.
We learned this the hard way in early deployments. Leave the decision to each engineer per ticket, and an engineer who meets three requests in a row with no precedent concludes the system is useless and never returns. Individual judgment per ticket is a terrible allocation mechanism. So we split the work by queue: queues with known strong coverage go to the assisted path, and coverage state rather than mood decides.
The consequence for the desk is a mix shift that arrives tower by tower. Access and account demand empties first. Endpoint demand thins next. The legacy application queue barely changes for a long time. One desk, three different realities, and a single set of desk-wide metrics that averages them into noise.
Which means the question for a desk leader is not “how much volume did we lose.” It is “which queues drained, what is left in them, and what skill does the residue need.” That is a per-queue question, and the standard desk dashboard cannot answer it.
The Concession: Headcount Does Not Follow Volume Down
This is where the economics have to be stated plainly, because the market is being dishonest in both directions at once.
One camp sells the headcount cut as the point. The other insists nothing changes for anyone. Most service leaders I talk to report pressure to cut frontline staff because of AI. Far fewer have actually done it. The pressure is real. The arithmetic of the residual is why it keeps stalling.
Our position is uncomfortable for both camps. The headcount curve does decouple from ticket volume, and I will not pretend otherwise. But it decouples after coverage is proven, queue by queue, and never as the first move. Cut the desk on the day the program launches and you have removed the people who handle the residue before the residue has shrunk.
The role changes before the number does. The engineer who used to close dozens of quick tickets a day becomes the engineer who validates what the system proposes on the hard ones, handles the exception the system declared it had no precedent for, and feeds the correction back. That is a different job with a different skill profile, and it is harder to hire for, not easier.
What This Changes
First, re-baseline the desk before the drain, not after. Record first contact resolution, handle time and cost per ticket by queue, and agree with the CIO in writing that they will worsen as the program succeeds. A metric that worsens by design is not a failure. An unbriefed metric that worsens is a budget review.
Second, measure the residual on different numbers. Accepted-recommendation rate, reopen rate, and escalation quality: did the ticket arrive at the next tier with the evidence attached. Volume metrics describe the work that left. These describe the work that stayed.
Third, look at how the desk is priced. If your outsourced desk is contracted per ticket, your supplier earns more when the drain fails, and the commercial incentive runs directly against the program. Pricing for operations has to fall when demand falls, or somebody in the chain is quietly rooting for the tickets.
Fourth, staff for difficulty. The desk you will end up needing is smaller and more senior, and the path there runs through retraining the people who already know the estate, not through a hiring freeze and a prayer.
The Question for IT Leaders
Pull your desk metrics by queue and ask which ones would get worse if your automation program worked perfectly. If the answer is most of them, your scorecard is measuring the work you are trying to remove.
So my question: has anyone told your CIO, in writing, that first contact resolution is supposed to fall?
Next week: inside a P1 with an agent on the call. What a major incident bridge looks like when the system takes the notes, correlates the signal and drafts the RCA, and the humans still make the decisions.
Sanjesh Rao leads product strategy and innovation for Hexaware’s Agentic ITOps platform.