Four frontier models in DeepSeek’s published comparison now sit within 0.6 points of each other on SWE-Bench Verified — two open-weight, two proprietary. Across the wider set of newer coding, agentic, and reasoning benchmarks, the convergence is similar. The honest comparison — biggest open-weight model against biggest closed-source, like-for-like — runs roughly 5.7× on price and single digits on capability. The argument your AI vendor has been making for the premium has, on the actual numbers, gone quiet.
The Argument in Brief
Open-weight frontier models have caught up on the newer coding and agentic benchmarks and narrowed the gap sharply on many others. Pricing hasn’t moved with it: like-for-like, closed-source still costs 5–18× more depending on tier. Some of the remaining leaderboard gaps look less decisive once you examine contamination, harness effects, and how the scores were produced. If you’re spending serious money on AI, the burden of proof has shifted: rerun the evals on your own workloads before the next renewal.
The Verified Cluster
SWE-Bench Verified is the closest thing the AI industry has to a standardized exam in software engineering: real GitHub issues, real failing unit tests, a binary pass-or-fail grade once the model takes a swing at a patch. For much of 2024 and 2025, every frontier lab benchmarked against it, and most vendor launch decks treated it as the default coding score. So, when four different models cluster within 0.6 percentage points of each other in DeepSeek’s published comparison, that means something — even if the vendors would prefer it didn’t. The two models DeepSeek’s table leaves blank on Verified score lower in third-party harness runs, which is itself part of the story: when the headline benchmark stops cleanly separating the field, you have to look elsewhere.
That’s where DeepSeek’s table sits as of late April 2026. Claude Opus 4.6 Max leads at 80.8%. Gemini 3.1 Pro and DeepSeek V4-Pro Max are tied at 80.6%. Kimi K2.6 lands at 80.2%. GPT-5.4 and GLM-5.1 aren’t in that row at all; third-party harness runs (Vellum, vals) place them at roughly 78% and 76% respectively. The four DeepSeek-reported scores are too close for Verified to separate; the other two need a different evaluation setup to score at all. Either way, Verified can no longer carry the procurement argument by itself, which is why the rest of this piece looks at the wider pattern.
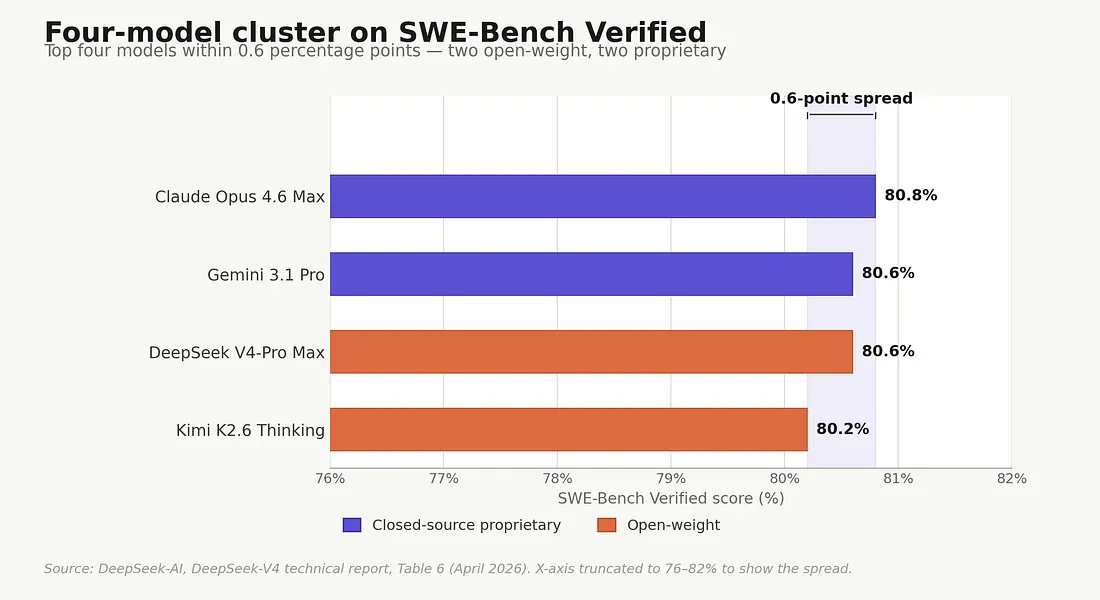
The four-model Verified cluster. All four scores fall within 0.6 percentage points; x-axis truncated to 76–82% to show the spread. GPT-5.4 and GLM-5.1 are blank in DeepSeek’s table; third-party harness runs (Vellum, vals) place them at roughly 78% and 76% — outside this cluster but using a different evaluation methodology, so not directly comparable. Source: DeepSeek-AI, DeepSeek-V4: Towards Highly Efficient Million-Token Context Intelligence, Table 6 (April 2026); see reference [1].
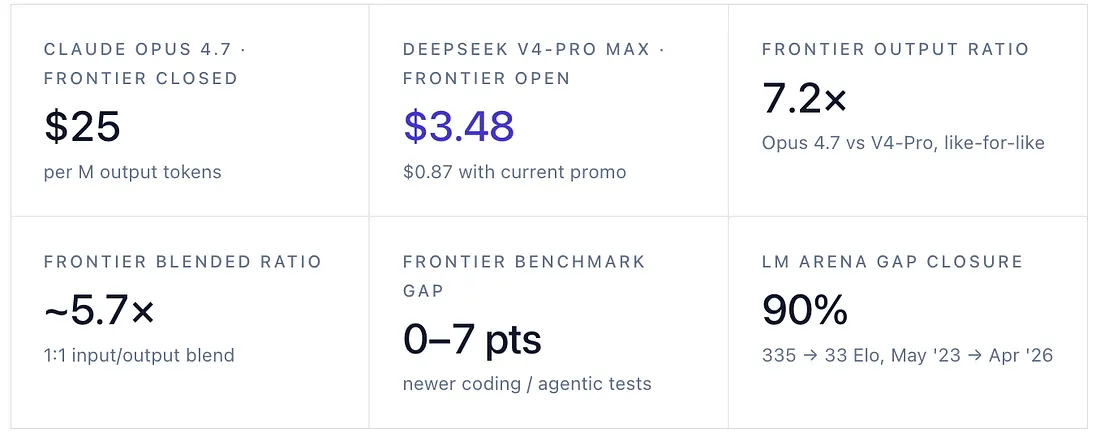
Now look at what these models cost. Anthropic charges $25 per million output tokens for Opus 4.6 (and the same for Opus 4.7, released April 16). DeepSeek’s V4-Pro, which only launched on April 24, charges $3.48 per million — and is currently selling at a 75% promotional discount through May 31, which puts the effective output rate around 87 cents. The smaller V4-Flash in the same family lists at 28 cents per million output tokens.[2]
A note on methodology before going further because it’s tempting to do this wrong. Comparing the cheapest open-weight option (V4-Flash at $0.28 output) against the most expensive closed one (GPT-5.5 Pro at $180) gives a dramatic 643× headline. That number is also misleading — V4-Flash and GPT-5.5 Pro aren’t in the same workload class, and almost no enterprise procurement actually puts them in head-to-head competition. The honest comparison is biggest-against-biggest at each tier, which is what this piece does throughout. The frontier figures above (5.7× blended, 7.2× output) are V4-Pro Max against Opus 4.7, both at maximum reasoning effort. At the budget tier, V4-Flash against Claude Haiku 4.5 ($5 output) is roughly 18× on output. At the mid-tier — Sonnet 4.6, GPT-5.4 mid — there is no exact open-weight analogue; DeepSeek’s lineup skips that band. And at the premium Pro/Fast tier, where GPT-5.5 Pro lists at $30 input / $180 output and Opus 4.6 Fast Mode at $30 / $150, there is no open-weight equivalent at all — that’s a service-quality tier (latency SLAs, dedicated capacity, premium support) rather than a capability tier, and self-hosted open-weight inference doesn’t have a corresponding product because the buyer is the service.[3] The right way to read the rate card is tier-by-tier.
On a like-for-like blended basis at the frontier, Opus 4.7 is roughly 5.7× the price of V4-Pro. The published benchmark picture no longer says these are categorically different classes of system; it says Opus has a real but workload-specific lead that buyers need to price explicitly.
When GPT-4 launched in March 2023, the premium was rational. The closed-source frontier was genuinely a long way ahead. On LM Arena — the leaderboard where humans rate model outputs head-to-head in blind comparisons — the gap between the highest-rated US chatbot and the highest-rated Chinese chatbot was 335 Elo points. As of late April 2026, it was 33 — Claude Opus 4.7-thinking at 1503 against Z.ai’s MIT-licensed GLM-5.1 at 1470. A 90% closure across 35 months.[4]
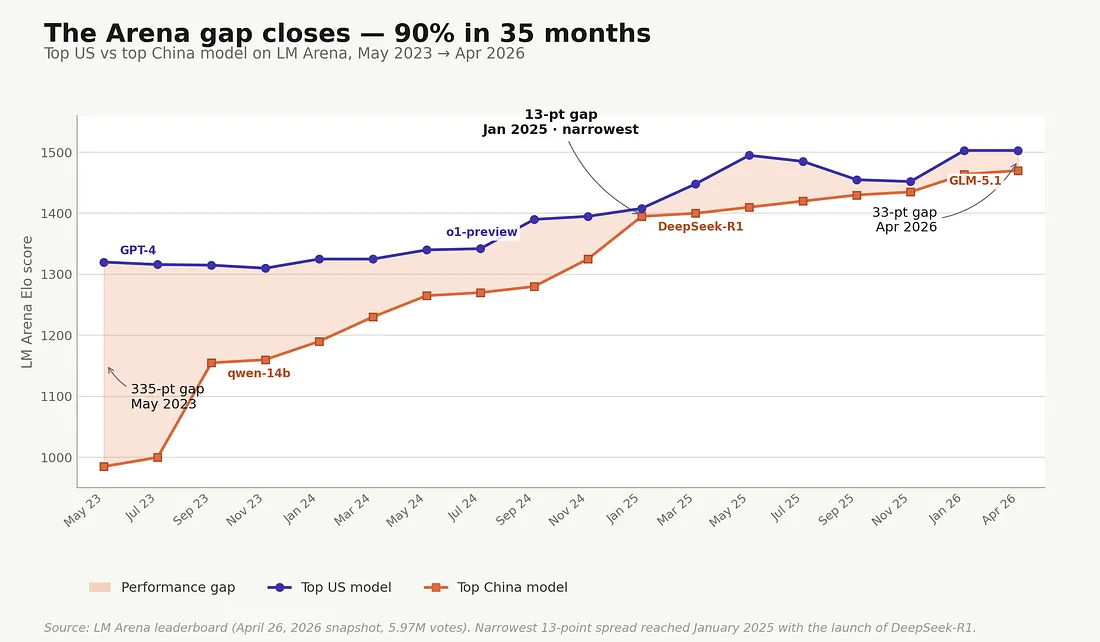
The Arena gap closes — 90% in 35 months. Highest-rated US model versus highest-rated Chinese model on LM Arena, May 2023 through late April 2026 quarterly snapshots. The gap reached its narrowest 13-point spread in January 2025 with the launch of DeepSeek-R1, widened modestly through 2025, and stood at 33 Elo points as of the April 26, 2026 leaderboard — Claude Opus 4.7-thinking at 1503 against Z.ai GLM-5.1 (MIT-licensed) at 1470. Author-compiled LM Arena snapshots; Stanford’s 2026 AI Index separately documented a U.S.–China spread of similar magnitude through March 2026.[4]
For a CXO, this isn’t really a story about benchmarks. It’s a story about a recurring line item that has stopped buying what it used to buy — and about the fact that the people writing the benchmark reports for you are the same people selling you the line item.
This essay is the first of three. Part 2 deals with the economics, including the reasoning-token tax that has quietly inflated AI bills even as headline token prices fell 99.5%. Part 3 takes apart the political dimension: Anthropic’s February 2026 accusations that DeepSeek, Moonshot AI, and MiniMax ran “industrial-scale distillation attacks” against Claude, set against the company’s own $1.5B copyright settlement five months earlier. The point of this piece is narrower. It is about what the performance numbers actually say once you strip out the marketing layer — and on that question, the answer is: on the newer, harder-to-game benchmarks where the methodology is most defensible, the gap has narrowed to somewhere between zero and seven percentage points. On at least three benchmarks, an open-weight model is the leader outright.
Where Caught-up Actually Shows Up
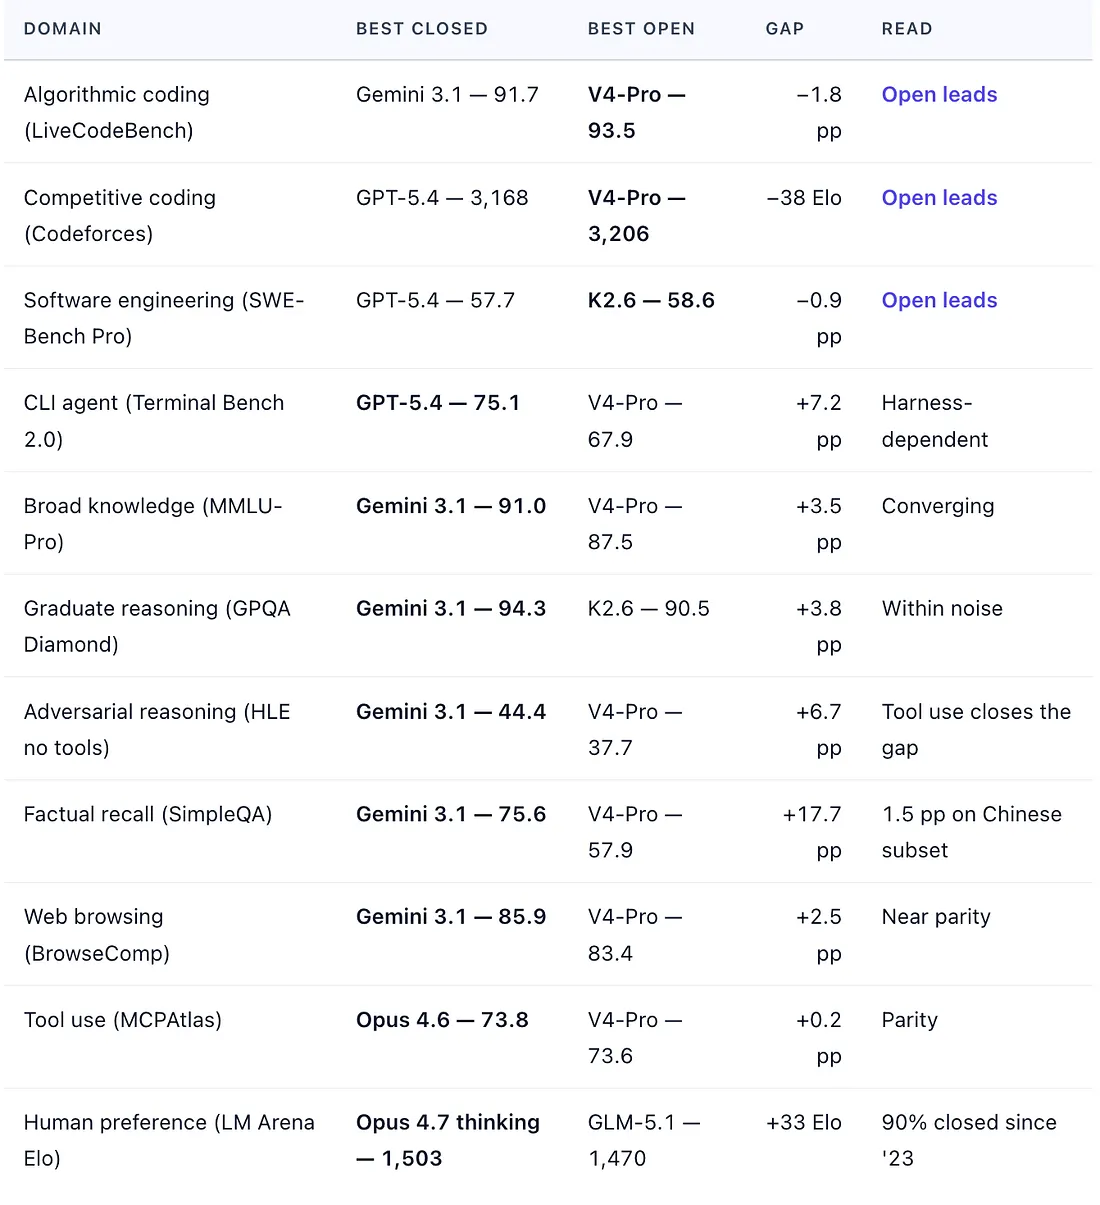
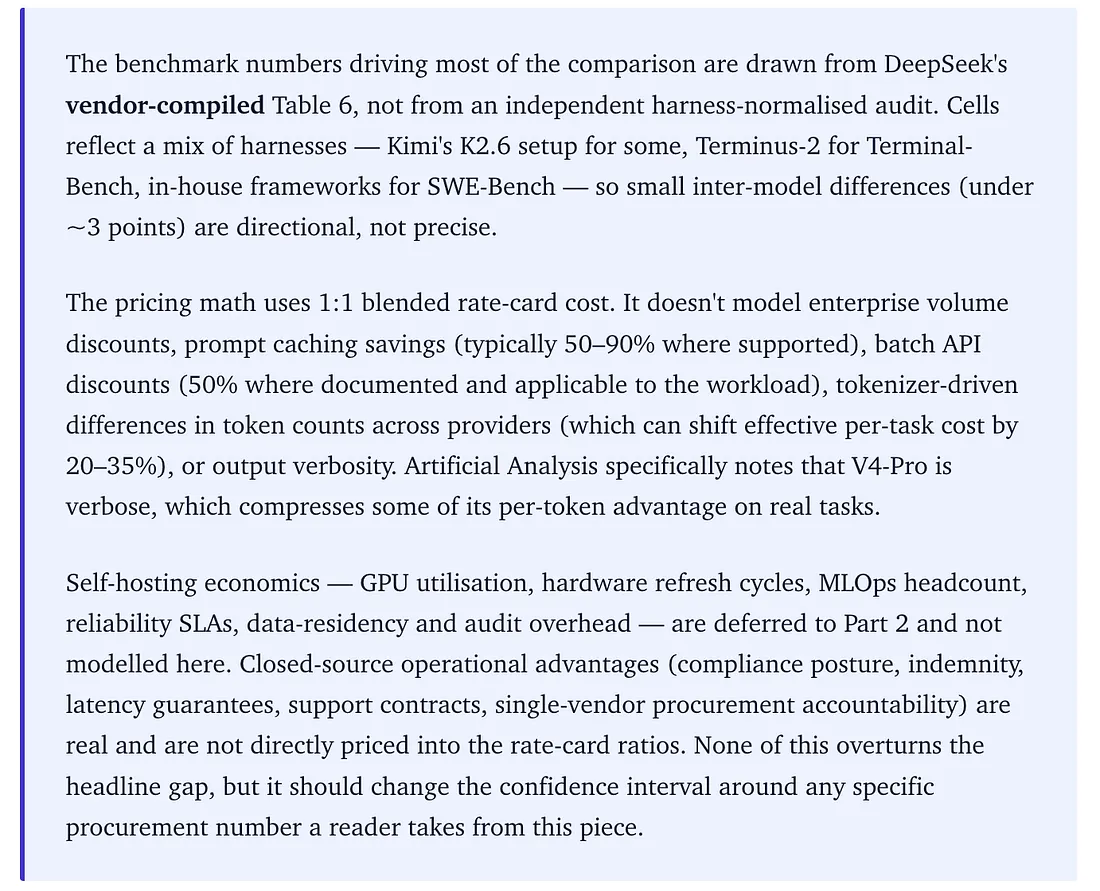
Even if Verified is the wrong place to look — and the next section explains why it might be — the same convergence pattern shows up on the benchmarks that are harder to game. Worth getting the numbers on the table before discussing what’s wrong with them. Most of what follows comes from the DeepSeek V4 technical report (Table 6, April 2026), which compiles DeepSeek V4-Pro alongside Claude Opus 4.6, GPT-5.4, Gemini 3.1 Pro, Kimi K2.6, and GLM-5.1 in a single published comparison — the cleanest cross-vendor compilation to date, but vendor-compiled rather than independently harness-normalized. Cells aren’t all reproduced under one uniform harness, so small differences (under ~3 points) should be read as directional rather than precise. [5]
On Codeforces, the dominant competitive-programming rating, DeepSeek V4-Pro Max scores 3,206 — an elite grandmaster-level rating on the Codeforces scale. GPT-5.4 sits at 3,168. Gemini 3.1 Pro at 3,052. Anthropic and Moonshot don’t publish Codeforces numbers for Opus 4.6 or Kimi K2.6, which is itself a small tell. The leader on the rating most frontier labs benchmark against is open-weight.
On LiveCodeBench-v6, which sources rolling competitive problems published after each model’s training cutoff and is therefore the single most contamination-resistant coding benchmark in regular use, V4-Pro Max scores 93.5% Pass@1. Gemini 3.1 Pro hits 91.7%. Kimi K2.6 hits 89.6%. Opus 4.6 hits 88.8%. The top four sit inside a 4.7-point band, and again the open-weight model leads.
On SWE-Bench Verified, the cluster discussed above. With one important footnote: Anthropic’s most recent model, Opus 4.7 (released April 16), reports 87.6% on Verified — about seven points clear of the cluster. That number sits awkwardly alongside what’s now public knowledge about the benchmark itself. OpenAI announced in February that it would deprecate Verified scores and recommend SWE-Bench Pro instead, citing contamination concerns.[6] More on that next section.
On SWE-Bench Pro, the harder cousin of Verified — 1,865 problems across 41 actively maintained repositories, split into public, private, and held-out sets, with the private split drawn from 18 proprietary codebases that are structurally resistant to training-set leakage[7] — the leader is Kimi K2.6 at 58.6%. GLM-5.1 (also open-weight) at 58.4%. GPT-5.4 at 57.7%. Opus 4.6 at 57.3%. DeepSeek V4-Pro at 55.4%. Anthropic’s Opus 4.7 reports a much higher 64.3% on Pro, which would clear the cluster, though that number hasn’t been independently reproduced and sits within the kind of large harness swing now visible across agentic coding benchmarks. On the publicly published cross-lab data, an open-weight model leads a major agentic-coding benchmark for the first time.
On LM Arena, the head-to-head human-preference leaderboard shows the gap discussed above. At a 33-point spread, the top US model wins something like 54–57% of head-to-head match-ups against the top Chinese model. That is meaningful, but it is not a different class of system, the way 335 points were in 2023.
On SimpleQA — closed-source’s strongest remaining lead — Gemini 3.1 Pro scores 75.6%; V4-Pro scores 57.9%. A 17.7-point gap, the largest on any benchmark in the comparison set. Worth noting that on the Chinese-knowledge subset, the gap collapses to 1.5 points (Gemini 85.9, V4-Pro 84.4), which is consistent with a corpus and domain-mix explanation rather than an architecture or scale story, though it doesn’t prove one without proper ablations.
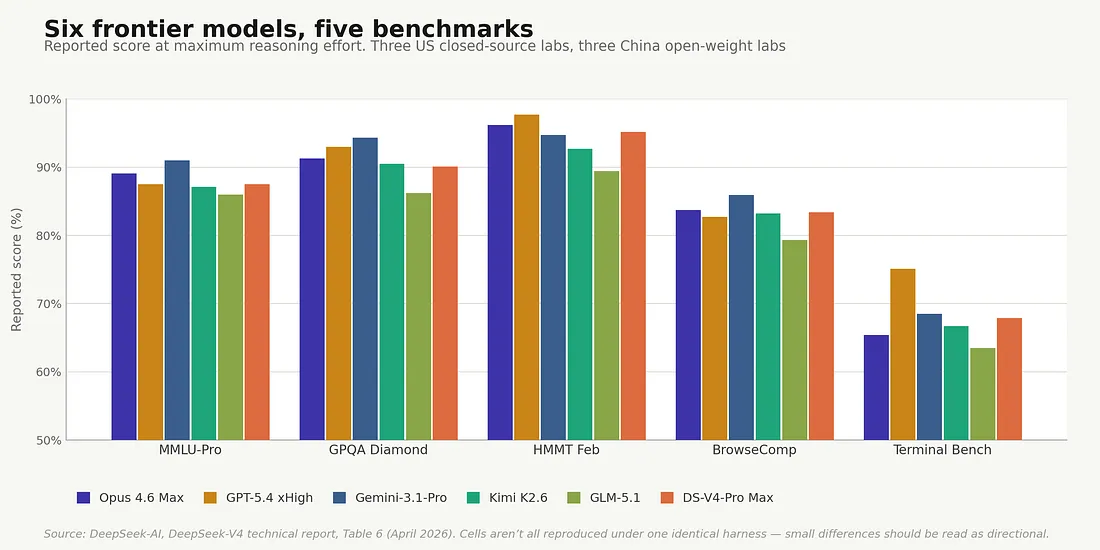
Six frontier models, five benchmarks. Reported scores at maximum reasoning effort (mix of Pass@1, accuracy, and exact-match depending on the benchmark) drawn from a single published comparison. Cells aren’t all independently reproduced under one identical harness, so small differences should be read directionally. Source: DeepSeek-AI, DeepSeek-V4: Towards Highly Efficient Million-Token Context Intelligence, Table 6 (April 2026).
The pattern across all 24 benchmarks DeepSeek reports is consistent: open-weight leads on algorithmic coding (LiveCodeBench, Codeforces); essentially ties Opus on Verified inside the four-model cluster; leads on Pro; trails by single-digit points on most of the rest; trails by double digits in two places — SimpleQA (which collapses on the Chinese-language subset) and Apex, an antigenic-reasoning benchmark where Gemini 3.1 Pro reports 60.9 against V4-Pro’s 38.3. DeepSeek’s own framing in the paper is, by the standards of model-launch literature, unusually candid: V4-Pro Max sits marginally behind GPT-5.4 and Gemini-3.1-Pro, on a trajectory the paper estimates as roughly three-to-six-months behind the closed-source frontier.[5] Three to six months is the right window to think about when the model in question costs less than a fifth of the alternative, and the contract you’re signing runs for two years.
The Contamination Problem
Here is the awkward thing about benchmarks in 2026: the ones where closed-source models look strongest are disproportionately the ones most affected by training-data contamination, and that’s not an accusation, it’s an empirical finding from the research community.
The most rigorous published audit of LLM benchmarks is Bean et al. at the Oxford Internet Institute — a systematic review of 445 benchmarks accepted at NeurIPS, ICML, ICLR, ACL, NAACL, and EMNLP between 2018 and 2024, conducted by a team of 29 expert reviewers.[8] The conclusion: nearly every paper in the sample had identifiable methodological weaknesses — vague phenomenon definitions, tasks taken from pre-existing data without checking representativeness, scoring metrics that didn’t actually map to the construct being measured, and almost no statistical testing of the kind that would distinguish a real performance difference from noise. About half the papers discussed validity at all. The picture isn’t that the field is uniquely careless; it is that benchmarks have grown from research artefacts into procurement instruments, and the methodology hasn’t kept up.
There is a related industry practice that compounds the credibility problem. Singh et al. (Cohere, MIT, AI2, Stanford), in a 2025 paper titled — drily — The Leaderboard Illusion, traced the practice of major labs submitting multiple private model variants to LM Arena and selectively publishing only the best score.[9] At the extreme, they identified 27 private variants tested by Meta in the run-up to the Llama-4 release. The Bradley-Terry rating system the leaderboard uses doesn’t account for this kind of selective disclosure, and Singh et al. show in controlled experiments that running ten variants and choosing the best can move a model up roughly 100 Elo points without any underlying capability change. The leaderboard, it turns out, has had a private testing channel that was available to a small number of preferred providers and not to everyone else. Of 243 models tracked over the study period, 64% of the silently deprecated ones were open-weight.
That’s the ambient methodology problem. The more specific one — contamination — is when a model is trained on data that includes the test set or content very close to it, so it scores higher than its actual capability warrants. The model is taking a test where it has, in some real sense, already seen the answer key.
The leading published contamination audit on SWE-Bench Verified is Liang et al., The SWE-Bench Illusion: When State-of-the-Art LLMs Remember Instead of Reason (arXiv 2506.12286, 2025).[10] Their findings break into three patterns, and all three matter.
Two Reasons Benchmark Numbers Don’t Mean What They Say
Memorization in SWE-Bench contamination — accuracy drops sharply when models are tested on repositories outside the SWE-Bench training set.
Harness scaffolding effects on Terminal Bench -harness — same model, different agent scaffolding, on Terminal Bench 2.0.
Sources: Liang et al. (2025); DeepSeek V4 technical report (April 2026); Kimi K2.6 model card; Terminal-Bench 2.0 leaderboard.
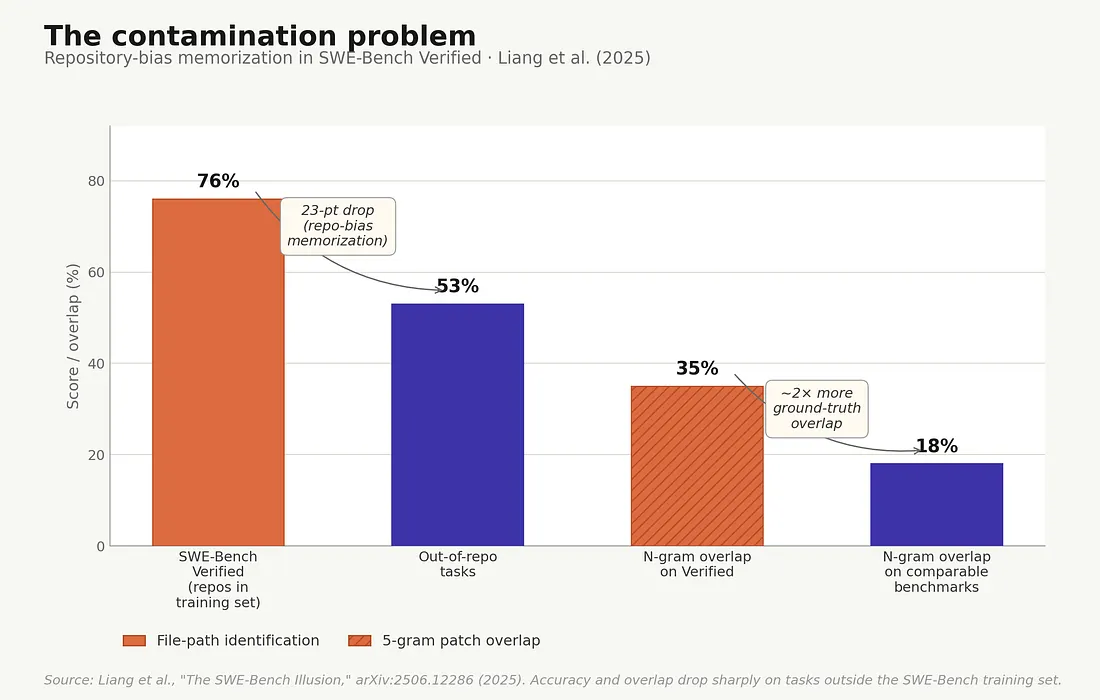
Repository-bias Memorization
Frontier models can correctly identify the buggy file path in a SWE-Bench Verified issue using only the issue description — without ever seeing the repository structure. State-of-the-art models hit up to 76% accuracy on this task. On issues drawn from repositories outside the SWE-Bench training set, accuracy falls to 53%. A 23-point drop. That’s the model recognizing the architectural conventions of repos it has seen many times during training, not solving novel software-engineering problems.
Instance-specific Memorization
On tasks drawn from the same repositories as Verified but excluded from the Verified split, accuracy still drops by roughly 10 points relative to the Verified score. Smaller drop, but it suggests that some of the specific issues themselves have leaked.
Code Overlap With Ground Truth
Liang et al. measured how much of the model’s solution overlapped with the ground-truth fix at the n-gram level. SWE-Bench Verified showed up to 35% consecutive 5-gram overlap with the ground-truth patch, versus around 18% on tasks from comparable but newer coding benchmarks. The model isn’t reasoning its way to those solutions on Verified. It is, in measurable part, recalling them.
This is, presumably, why OpenAI publicly stopped reporting Verified scores in February — and explicitly recommended that other developers stop using it as a frontier-capability measure. The benchmark has stopped doing what it used to. And yet the Verified number is still everywhere in vendor decks, including ones that landed on procurement desks last week.
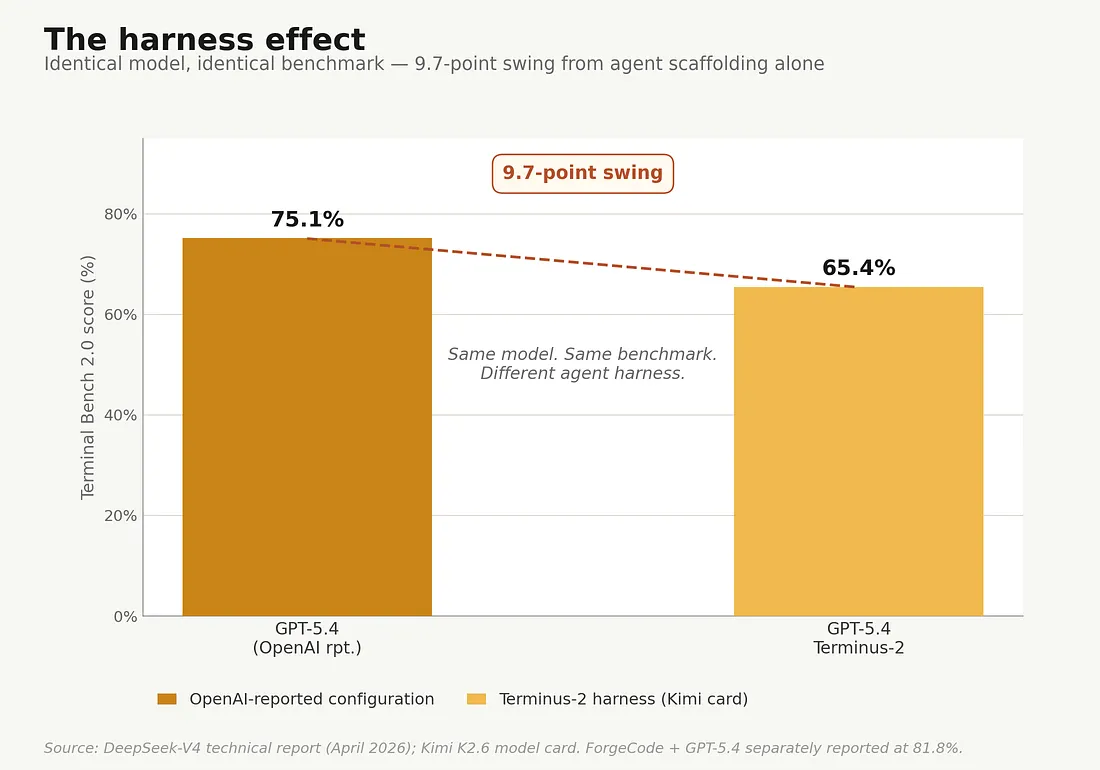
The Harness Effect
There’s a second, less-discussed problem with current benchmarks. Harder to fix than contamination, and arguably worse for procurement.
Modern benchmarks, especially agentic ones, measure the model plus its scaffolding — not the model alone. The scaffolding is the agent harness: the orchestration code that lets a model call tools, edit files, run tests, retry failed actions, and chain reasoning over a long task. The benchmark scores you read are scores for a model running a particular harness on a particular evaluation. Different vendors run different harnesses.
The right panel of the chart above shows how much that matters. On Terminal Bench 2.0, GPT-5.4 scores 75.1% on OpenAI’s own reported configuration, and 65.4% when run on the Terminus-2 harness as reported on Kimi’s K2.6 page. Same model, same benchmark, 9.7-point swing entirely from the scaffolding. The official Terminal-Bench leaderboard separately lists ForgeCode + GPT-5.4 at 81.8%, which would widen the gap to 16+ points across harnesses. SWE-Bench Pro shows similarly wide swings across published harness/agent combinations.
There are at least seven distinct agent harnesses in regular published use: SWE-Agent, the in-house frameworks at Moonshot and DeepSeek, Claude Code, Terminus-2, ForgeCode, TongAgents, and Codex CLI. The scores aren’t strictly comparable. The industry mostly pretends they are.
For a buyer, this matters in two ways. When you read a comparison chart that shows Vendor A’s model at 75% and Vendor B’s at 65%, a meaningful portion of that 10-point difference is harness, not model. And — more importantly for whatever you’re actually deploying — your harness will not be Vendor A’s harness. Production performance depends on how well your team builds the orchestration around the model, which means the vendor’s score is, at best, an upper bound on what you’ll get if you also pay them for the integration work, and a much less reliable signal if you’re going to do your own integration anyway.
The pattern is increasingly visible in deployment write-ups: a well-built harness around an open-weight model can match or beat a poorly integrated frontier closed-source model in production. There’s also genuine architectural innovation on the open-weight side that benchmark scores don’t capture. Kimi K2.6, for instance, ships with a parallel sub-agent system that can decompose complex tasks into up to 300 concurrent sub-agents, each handled by a specialized instance — a capability that lives at the system layer, not the model layer, and that points to where open-weight differentiation may go next.
What the Gap Actually Looks Like
Where does that leave the real capability gap between open and closed in 2026? On the newer, harder-to-game benchmarks where the methodology is most defensible: typically, zero to seven percentage points, concentrated in long-horizon agentic execution and the most difficult frontier-IQ tasks. A selected capability landscape, drawn from the same DeepSeek V4 reference data:
Gap = best closed minus best open; negative values indicate open leads. Sources: DeepSeek V4 technical report Table 6 (April 2026); arena.ai/leaderboard/text, April 26, 2026, snapshot (5.97M votes, 351 models). Cross-lab numbers reflect each lab’s own evaluation harness; differences under ~3 points should be read as directional.
Open-weight leads in three categories, is within 3.5 percentage points on three more, trails by 3.8–7.2 points on three, has one clear double-digit miss (SimpleQA, which collapses to 1.5 points on the Chinese subset), and remains within 33 Elo on LM Arena.
What does zero to seven points look like for the workloads that account for most enterprise AI spend? For many support, RAG Summarization, classification, and extraction workloads, the bottleneck is often retrieval quality, data cleanliness, routing, policy design, and integration — not the last few leaderboard points. That makes the frontier premium hard to justify unless the buyer’s own eval shows a durable gap on the actual workload.
Where the 4–7 point gap is still real and felt:
- Highly autonomous, long-horizon agents that need to chain dozens of tool calls and recover gracefully from intermediate failures. Closed-source has an edge here that’s narrowing fast and is, as discussed, harness-dependent.
- Frontier knowledge tasks at the edge of what any model can do. Humanity’s Last Exam, IMO-class Olympiad reasoning. Worth flagging that with tools enabled, Kimi K2.6 leads HLE-with-tools at 54.0% (against GPT-5.4 at 52.0% and Opus 4.6 at 53.1%), so even this lead is conditional on what you let the model use.
- Specific high-stakes domains where a 1–2 point MMLU-Pro advantage might translate into better trade execution, or marginally better diagnostic suggestions. These are real but extremely narrow.
Net of all that, closed-source frontier still has a small lead on a small set of capabilities that most enterprise workloads don’t draw on. Everywhere else, the choice between Claude Opus 4.7 and DeepSeek V4-Pro is a choice between two production-grade tools at radically different price points — though the operational and compliance work needed to deploy them is not symmetric.
Price Against Performance — the Full Landscape
Once the performance gap shrinks to single digits, the price-vs-performance picture comes into focus. The Artificial Analysis Intelligence Index (AAII) is one of the cleaner cross-vendor performance composites — an aggregate currently spanning GDPval-AA, τ²-Bench Telecom, Terminal-Bench Hard, SciCode, AA-LCR, AA-Omniscience, IFBench, HLE, GPQA Diamond, and CritPt (snapshot: April 28, 2026). Plotted against blended cost per million tokens, it produces this:
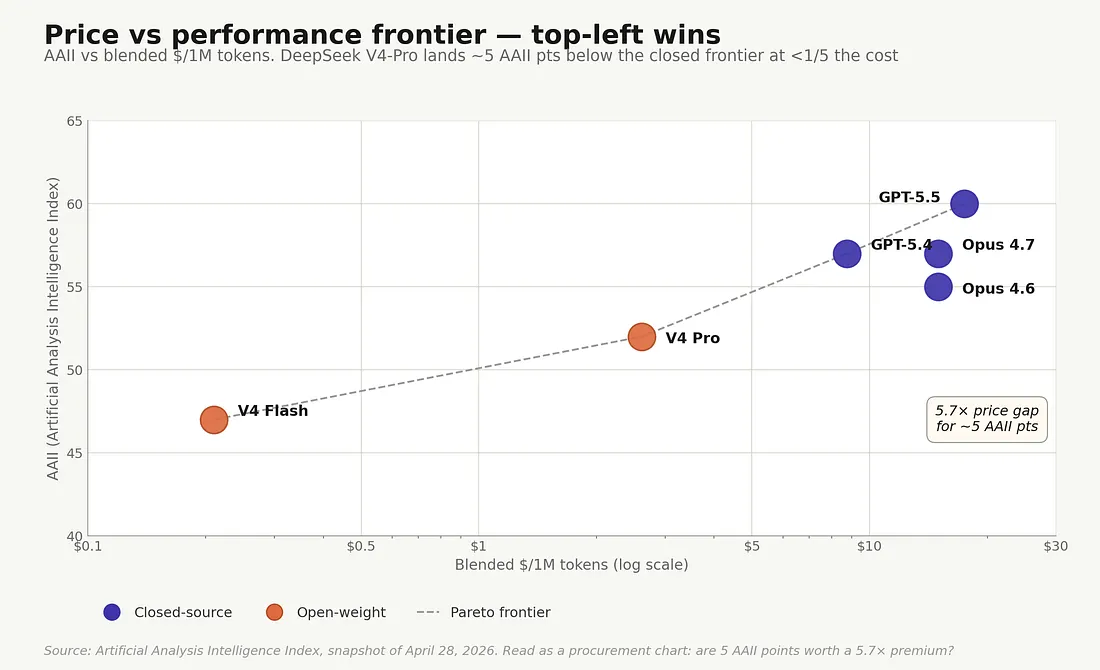
Price against performance — top-left wins. AAII scores from Artificial Analysis; x-axis is author-calculated 1:1 blended standard API rate-card pricing (the convention used throughout this piece, not Artificial Analysis’s own cost methodology). DeepSeek V4-Pro lands roughly five to eight AAII points below GPT-5.5 and Opus 4.7, at less than a fifth of their cost. Source: Artificial Analysis Intelligence Index, snapshot of April 28, 2026. Read this as a procurement chart, not a leaderboard: the question is whether the extra five to eight AAII points are worth a five-to-seven-times rate-card premium for your specific workload.
GPT-5.5 sits in the upper right at AAII 60, around $17.50 per million blended tokens. Claude Opus 4.7 at AAII 57, $15.00. DeepSeek V4-Pro at AAII 52 — five to eight points below the closed-source frontier — at $2.61 per million blended tokens. Less than a fifth of the cost. (Artificial Analysis notes that V4-Pro is verbose in output, so its per-token advantage shrinks somewhat once you account for typical task completion length, though the headline blended ratio still holds against Claude and OpenAI.) Outside the plotted frontier points, the nearest budget-tier closed comparison to V4-Flash (AAII 47, $0.21 blended) is GPT-5.4 Mini at roughly $2.63/M blended — about 12.5× the price for similar-tier capability.
The fuller pricing picture is in the table below. It’s worth scanning, because the standard rate-card story (Opus at $25, GPT-5.5 at $30) understates how stratified the frontier has actually become.
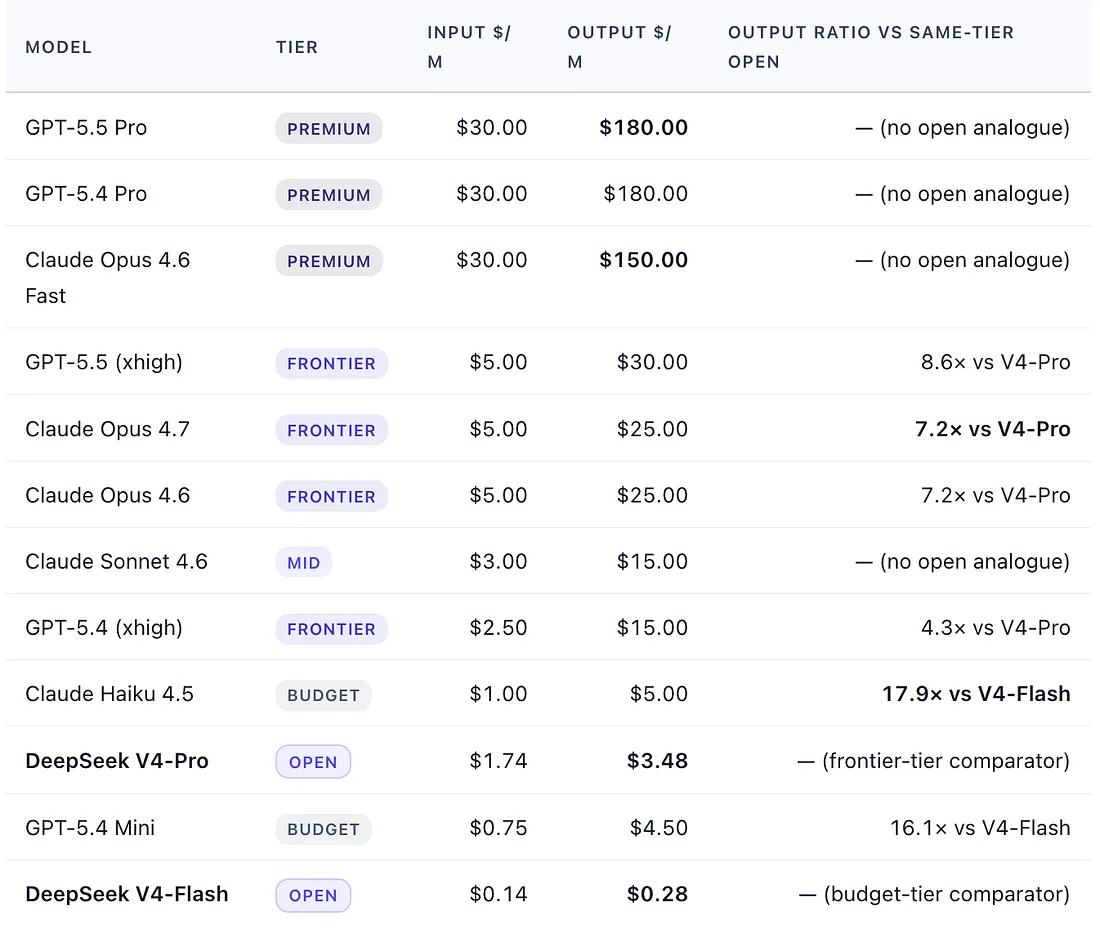
Standard service tier; batch API discounts (typically −50% where documented), prompt caching discounts (−50% to −90%), and enterprise volume pricing not shown. Ratios compare each closed-source model to the open-weight frontier model (V4-Pro) or open-weight budget model (V4-Flash) at the same capability tier — like-for-like, not cheapest-vs-most-expensive. The Premium and Mid tiers have no open-weight analogue, so no ratio is shown for those rows. Sources: vendor rate cards; Artificial Analysis; OpenRouter; DeepSeek API documentation. V4-Pro promo discount valid through May 31, 2026.[2,3]
The procurement-relevant comparison is frontier-vs-frontier and budget-vs-budget: 7.2× on frontier output, 17.9× on budget. Not “cheapest open versus most expensive closed.”
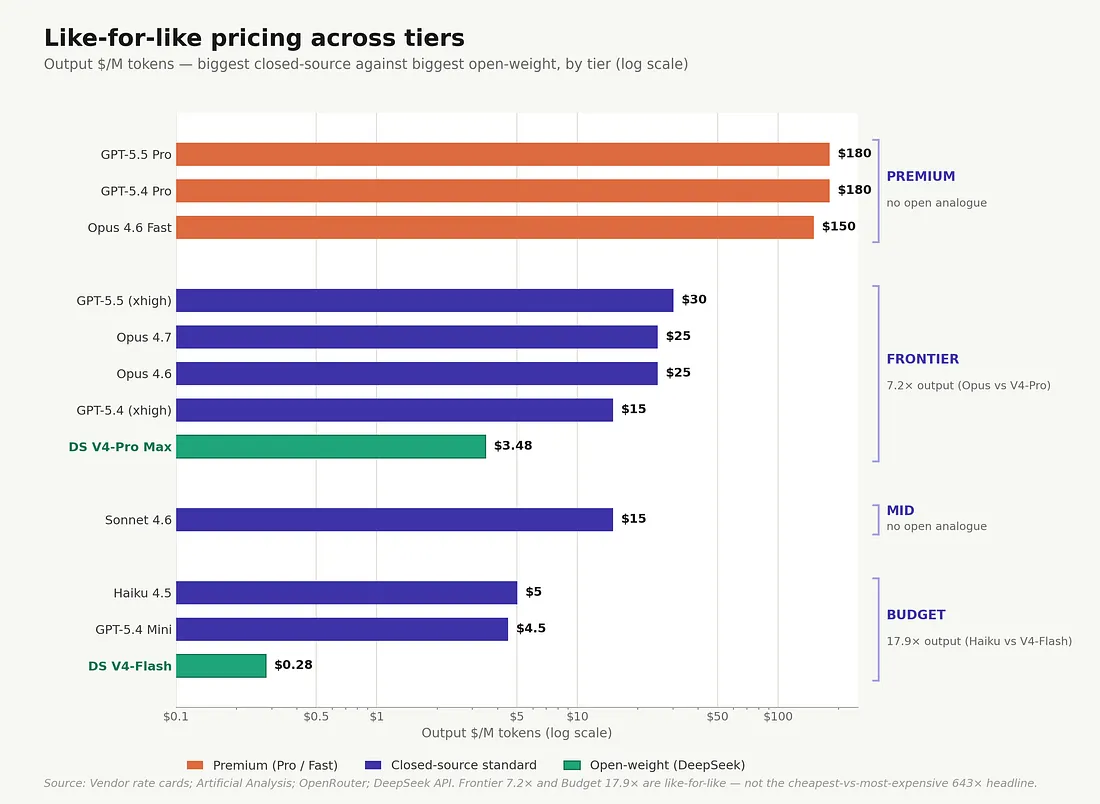
Like-for-like pricing across tiers — the procurement view. At the Frontier tier, the spread is 7.2× on output tokens (5.7× blended). At the Budget tier it’s 17.9×. The Premium Pro/Fast and Mid tiers are closed-source-only product offerings with no open-weight analogue. None of these spreads resembles the dramatic 500–643× headline that comes from comparing the cheapest open-weight option against the most expensive closed-source one.
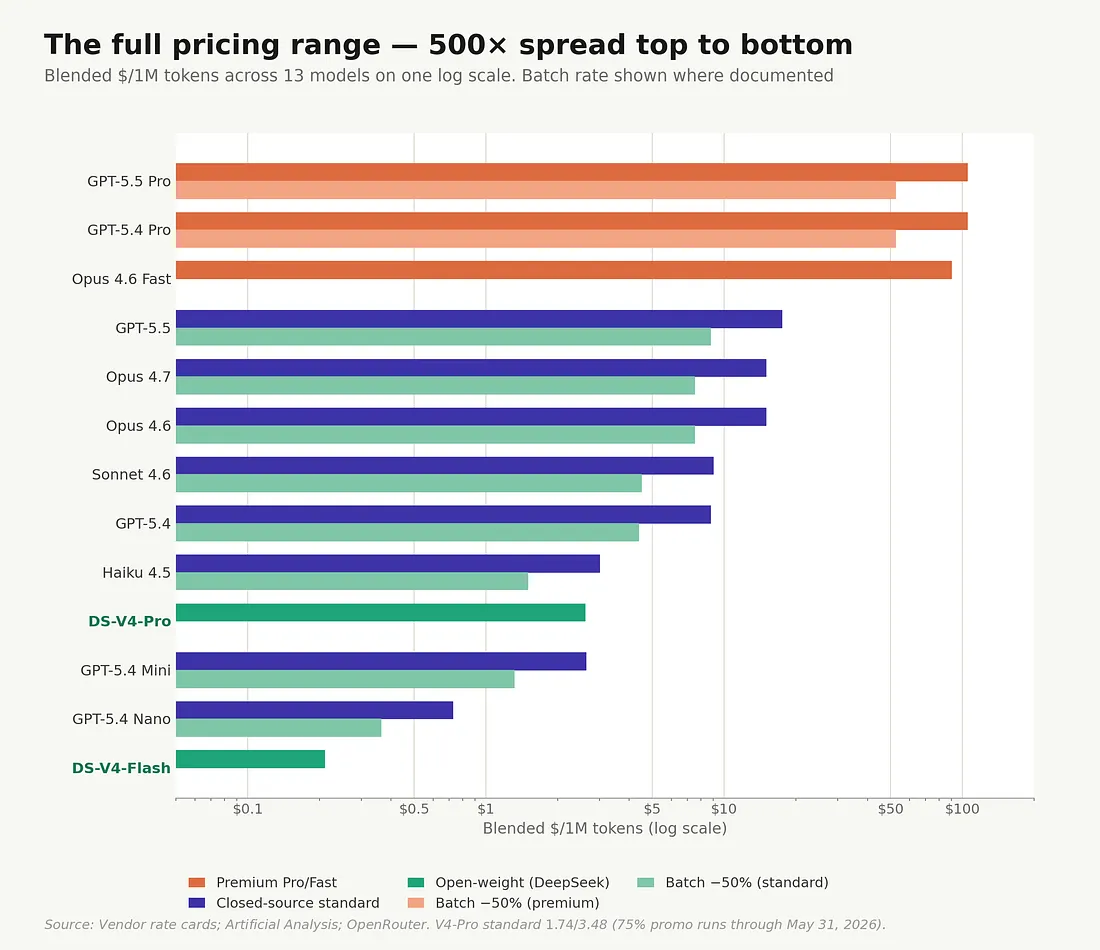
The full pricing range — top to bottom, ~500× blended, ~643× on output. That spread is a market-structure observation, not a procurement choice — closed-source vendors have stratified into a premium service-quality tier with no open-weight analogue. The procurement-relevant figure is the like-for-like frontier ratio: 5.7× blended.
The premium tiers — GPT-5.5 Pro, GPT-5.4 Pro, Opus 4.6 Fast — are doing something specific. They aren’t capability tiers exactly; they are service-quality tiers, marketed at the workloads where speed-of-response and reasoning depth carry an outsized commercial value. Legal review where one wrong opinion costs the firm a client. Financial modelling where one wrong assumption costs eight figures. Scientific judgment where the cost of being wrong is a failed experiment. The pricing is targeted at the upper tail of consequence-per-token, and the premium is six times the standard frontier rate.
The pattern matters. When capability gains across the frontier slow — when the most-cited coding benchmark no longer cleanly separates the field — vendors start monetizing the dimensions that have nothing to do with capability: speed, support contracts, reliability SLAs, data-residency guarantees, integration polish. Those are real and worth paying for. For many high-volume buyers, they are unlikely to be worth 5.7× at the frontier or 17.9× at the budget tier without workload-specific proof, let alone the unhedged premium of the Pro/Fast service tier above it.
Three Questions for the Next 90 Days
If you are responsible for AI procurement at any organization spending above $100,000 a month on frontier-tier AI tokens — roughly six to seven billion tokens of monthly volume at $15–17.50 per million blended rate-card pricing — three questions are worth answering this quarter.
- Are we paying a premium based on benchmark numbers that are no longer credible?
If your last competitive AI evaluation was more than twelve months ago, the answer is almost certainly yes. The benchmarks that anchored 2024–2025 vendor pitches — HumanEval, AIME 2025, MMLU, in some cases, Verified itself — are now saturated, contaminated, or both. Insist on a re-evaluation that uses the contamination-resistant set (LiveCodeBench, SWE-Bench Pro, Humanity’s Last Exam, Codeforces) and that is run by your team with your harness, not by the vendor with theirs. - Have we ever benchmarked an open-weight option against the incumbent on our actual workloads? For most enterprises, the answer is still no, usually because the gap was assumed to be too large to be worth the engineering cost. That assumption was correct in 2023 and 2024. It is not correct in 2026. A four-week parallel pilot of V4-Pro (self-hosted, or via a third-party hosted endpoint outside China for regulatory reasons — more in Part 3) against Opus or GPT-5.5 on your top three workloads is now standard due diligence rather than exotic experimentation.
- What is the unit-economics break-even point at our current AI volume? Part 2 digs into this in detail. Under the utilization and hardware assumptions modeled there, high-volume deployments can move from marginal savings to seven-figure annual savings quickly — the curve gets steep around the ten-billion-tokens-per-month threshold and is decisive by a hundred billion. If your annual AI bill is in seven figures and you haven’t modeled this, that’s worth fixing.
What This Isn’t
To be clear about what the argument here isn’t: it isn’t “rip out your closed-source vendor on Monday.” There are real cases where closed-source stays the right answer. A 50-person company with no MLOps capability and an annual AI spend in the low single-digit millions: the operational simplicity of a managed API genuinely outweighs the unit-cost advantage of self-hosting. A workload that lives in one of the narrow domains where the 4–7 point gap matters — high-end algorithmic trading, frontier scientific reasoning, the most demanding long-horizon agentic systems — can still justify the premium. An engineering team that can’t maintain a self-hosted inference stack to a 99.9% reliability SLA shouldn’t pretend it can; pay for the API and build the differentiation higher in the stack.
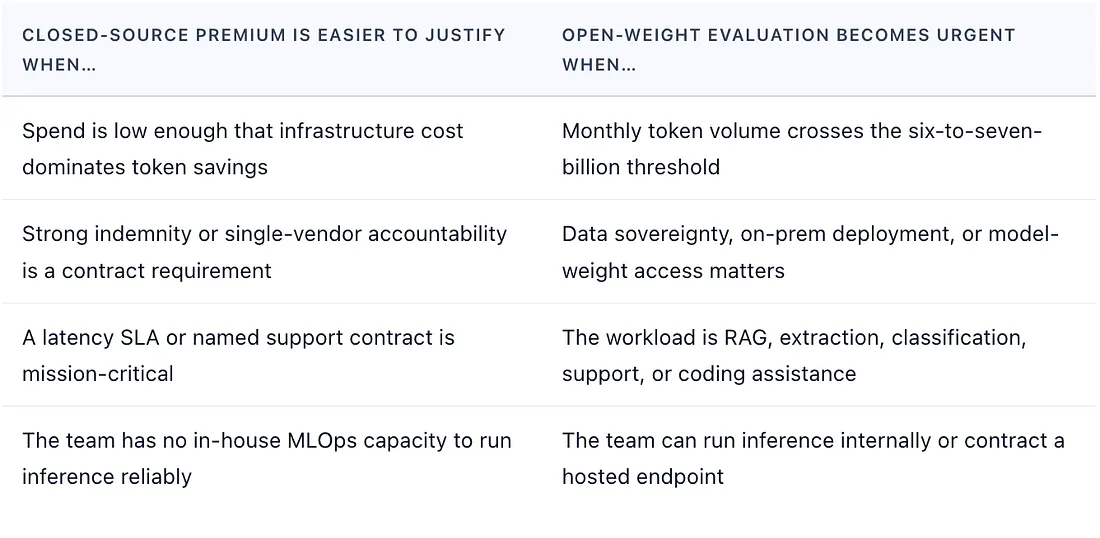
A rough decision frame, not an exhaustive checklist. Most enterprises will find themselves in both columns at once on different workloads — the question is which workloads belong in which column.
The argument is that the burden of proof has shifted. Three years ago, the default was “use the closed-source frontier unless you have a strong reason not to.” Today, for any organization spending above $100K a month on frontier-tier AI — six billion tokens or more in monthly volume — or any organization with non-negotiable data-sovereignty requirements, the burden runs the other way: high-volume buyers should benchmark open-weight frontier models on their own workloads before renewing closed-source contracts, and use closed-source where they can specifically articulate the capability, operational, or compliance gap that justifies the premium. Most enterprise AI strategies are still operating on the old default.
Before You Act On This
A few things worth keeping in view before applying any of these numbers to a procurement decision.
What Would Change This Conclusion
The argument here is empirical, not ideological. A few specific developments would weaken or invalidate it.
A harness-normalized, independently run evaluation showing a durable 10–15 point closed-source lead on actual enterprise workloads; evidence that open-weight deployments lose most of their rate-card advantage once tokenization, verbosity, support, reliability, and compliance costs are properly accounted for; or self-hosting break-even points that fall apart at materially higher usage thresholds than Part 2 will model. The published gaps are typically zero to seven points on benchmarks with known contamination or harness artefacts; a credible audit producing a wider gap would change the picture, and so would a Part 2 TCO model that collapses the 5.7× frontier ratio below 2× under fair accounting.
One additional condition is worth singling out, because it’s the most specific empirical claim currently on the table. OpenAI’s GPT-5.5 launch position is that the model uses approximately 40% fewer output tokens than GPT-5.4 on Codex tasks at matched per-token latency, which collapses the headline 2× sticker-price increase to a roughly 20% net cost increase per task. One third-party measurement reports 72% fewer output tokens than Claude Opus 4.7 on identical coding tasks. If those gains generalize beyond Codex to the workloads most enterprises actually run — RAG, extraction, classification, support, document analysis — and the per-task cost (not the per-token cost) for GPT-5.5 lands at or below V4-Pro’s on independent measurement, the headline 8.6× output-rate gap is misleading and the rate-card framing this piece runs needs to be reframed in tokens-per-completed-task. Currently, the 40% figure is self-reported, scoped narrowly to Codex, and not independently replicated on broader workloads; the 72% Opus comparison is third-party but limited to coding. Both would have to clear that bar against V4-Pro specifically — which is itself dense and token-efficient by Anthropic’s verbose standard — for the falsification to land.[14]
None of those is the current state of the public record. Until one of them is, the burden of proof sits on the premium.
Where This Leaves Us
The performance argument that closed-source vendors have leaned on to defend their pricing has, on the published numbers, lost most of its force. Where the benchmarks aren’t contaminated, they show parity or near-parity. Where they show closed-source leading, the lead is real but narrow, concentrated in capabilities most enterprise workloads don’t use, and shrinking at every release cycle.
Which raises the question the rest of this series will spend its time on: if the performance argument is gone, what is the closed-source price premium actually buying?
What does the premium buy? “Operational simplicity, support, and integration polish” is the short version. Those are real, and they are worth paying for — closed APIs still earn a premium on compliance posture, indemnity, latency SLAs, support contracts, managed tooling, and the procurement-friendliness of a single accountable vendor.
The question is how big a premium. Depending on workload, support needs, and compliance posture, those operational advantages can plausibly justify something on the order of 2× — not the 5.7× the rate card asks for at the frontier, and not the 17–18× it asks for at the budget tier. The 2× is a rough order-of-magnitude reasonableness check rather than a derived figure, and it is the place this argument is most exposed: a buyer with a strong indemnity requirement, a hard latency SLA, or no MLOps capability could rationally pay more.
Even granting the service-quality framing from earlier in the piece, the premium Pro/Fast tier is the part of the rate card hardest to defend on output pricing alone: $150–180/M for Opus Fast and the GPT Pro tiers against $3.48/M for V4-Pro API is a 43–52× gap on the published numbers. Whether self-hosting closes that further depends on volume and utilization — Part 2 takes that math seriously.
If the performance argument has weakened and the rate-card premium is hard to justify on operational advantages alone, what’s left? Three things the closed-source incumbents have been leaning on harder as the benchmark argument has thinned out. None of them are about model capability per se.
The Hidden Token Economics
Reasoning models, tokenizer drift, premium tiers — have created a layer of cost inflation that headline price-per-token comparisons miss; some models are quietly more expensive than they look, others quietly cheaper.
The Legal-and-Political Moat
This is the more delicate one. Anthropic’s February 23, 2026, disclosure accuses DeepSeek, Moonshot, and MiniMax of running coordinated “industrial-scale distillation campaigns” against Claude — 24,000 fraudulent accounts, 16 million exchanges in total. The per-lab breakdown is uneven: MiniMax ~13M (roughly four-fifths of the traffic), Moonshot ~3.4M (roughly a fifth), DeepSeek ~150K (under 1%). Yet DeepSeek leads the coverage in CNBC, Bloomberg, and the Washington Post. The 150K figure sits roughly an order of magnitude below the smallest published reasoning-distillation corpus used to train a competitive open-weight model (QwQ-32B’s 1.2M is about 8× larger; AM-Distill, DeepDistill, and DeepSeek-R1’s own corpus run several times larger again), and well within the range any serious lab generates running a competitor through twenty-plus benchmarks with statistical replication. That doesn’t prove DeepSeek was only benchmarking, but it does make its case materially weaker than the 13M and 3.4M figures attached to MiniMax and Moonshot, which are categorically different. Conflating all three under one headline is rhetorical, not evidentiary. Part 3 walks through the volume math. [11,13]
The framing also sits awkwardly alongside Anthropic’s own context. The company’s September 2025 settlement of $1.5 billion in Bartz v. Anthropic — where Judge Alsup ruled that training on legally acquired works was fair use, but that retention of pirated books infringed copyright — sits five months before the distillation post. Part 3 unpacks the rest.[12]
And then there is the original moat — the narrative that frontier intelligence is irreducibly hard, the kind of thing only labs with $100B in capital can produce. True in 2023; shakier in 2026. The release cadence from DeepSeek, Moonshot, Z.ai, and Mistral over the past twelve months suggests it was time-limited rather than structural.
Before the next renewal, rerun the evals on your own workloads, with your own harness. That is the only number that matters.
Part 2 lands the money story. The reasoning-token tax. The GPT-5.5 paradox, where a 2× sticker-price increase combined with a 40% efficiency gain still produces a 20% net cost increase. The hyperscaler ROI math, the hardware curves, the actual break-even points. If Part 1 asked whether the premium is buying you better performance, Part 2 asks whether it’s even buying you what the rate card says it is.
Sources
- SWE-Bench Verified scores from DeepSeek-AI, DeepSeek-V4: Towards Highly Efficient Million-Token Context Intelligence, Table 6 (April 2026). GPT-5.4 and GLM-5.1 are blank in that row; their Verified scores referenced in the body come from third-party harness runs published by ai (SWE-Bench leaderboard)and Vellum.ai (Opus 4.7 cross-model benchmarks). The vals.ai leaderboard carries both the GPT-5.4 (~78%) and GLM-5.1 (~76%) figures; the Vellum analysis carries the GPT-5.4 cross-comparison.
- DeepSeek API pricing page, accessed April 28, 2026 (api-docs.deepseek.com); Anthropic Claude pricing page (claude.com); Artificial Analysis V4-Pro provider page. DeepSeek’s official documentation lists the V4-Pro 75% promotional discount as extended until 2026/05/31 15:59 UTC; some early press coverage (The Next Web, Dataconomy, TechBriefly, all April 26, 2026) reported the earlier May 5 date that has since been superseded by DeepSeek’s own docs.
- Premium-tier pricing ($30/$180 for GPT-5.5 Pro and GPT-5.4 Pro; $30/$150 for Claude Opus 4.6 Fast Mode) from OpenAI and Anthropic published rate cards, cross-validated by Artificial Analysis and OpenRouter aggregators.
- LM Arena leaderboard quarterly snapshots, May 2023 — April 2026, accessed via ai/leaderboard/text(April 26, 2026 snapshot: 5,967,203 votes across 351 models). Top US: claude-opus-4–7-thinking at 1503±8; top China: glm-5.1 (Z.ai, MIT) at 1470±6 — gap of 33 Elo points. Cross-referenced with the Stanford 2026 AI Index report. The capability table also incorporates the Arena row.
- DeepSeek-AI, DeepSeek-V4: Towards Highly Efficient Million-Token Context Intelligence, Table 6 (April 2026). Reasoning effort: Opus 4.6 Max, GPT-5.4 xHigh, Gemini 3.1 Pro High, K2.6 Thinking, GLM-5.1 Thinking, V4-Pro Max.
- OpenAI developer announcement, February 2026 (deprecating SWE-Bench Verified, recommending SWE-Bench Pro). Confirmed in OpenAI documentation updates and reporting at the time.
- Deng, X. et al., “SWE-Bench Pro: Can AI Agents Solve Long-Horizon Software Engineering Tasks?”, arXiv:16941(2025). 1,865 problems across 41 actively maintained repositories, split into public, private, and held-out sets; private split contains 276 instances drawn from 18 proprietary codebases.
- Bean, A. M. et al., “Measuring what Matters: Construct Validity in Large Language Model Benchmarks,” arXiv:04703(2025). Systematic review of 445 benchmarks across NeurIPS, ICML, ICLR, ACL, NAACL, and EMNLP, conducted by 29 expert reviewers at the Oxford Internet Institute.
- Singh, S. et al., “The Leaderboard Illusion,” arXiv:20879(2025). Analysis of approximately 2 million Chatbot Arena battles, 243 models, 42 providers, January 2024 — April 2025. The 27-private-variant figure refers specifically to Meta in the lead-up to the Llama-4 release. The paper supports the broader claims about private-testing channels, selective disclosure, Arena data asymmetry, and selection-driven Elo gains.
- Liang, A. et al., “The SWE-Bench Illusion: When State-of-the-Art LLMs Remember Instead of Reason,” arXiv:12286(2025).
- Anthropic, “Disrupting model misuse: industrial-scale Claude distillation campaigns,” company blog, February 23, 2026 (com/news/detecting-and-preventing-distillation-attacks); reporting in Bloomberg, CNBC, CNN, South China Morning Post. Anthropic’s disclosed exchange volumes by lab: MiniMax ~13M (roughly four-fifths), Moonshot AI ~3.4M (roughly a fifth), DeepSeek ~150K (under 1%); rounded volumes don’t sum precisely to the headline 16M. White House Office of Science and Technology Policy memo NSTM-4, “Adversarial Distillation of American AI Models,” signed by OSTP Director Michael Kratsios, April 23, 2026. Friday-dated State Department cable to diplomatic and consular posts, reported by Reuters on April 24, 2026 (reuters.com).
- Bartz v. Anthropic PBC, settled September 2025: $1.5 billion settlement covering approximately 500,000 titles at roughly $3,000 each — the largest copyright settlement in US history. Judge William Alsup found training Claude on legally acquired works to be fair use, but ruled that Anthropic’s retention of pirated books from Library Genesis and Pirate Library Mirror infringed the authors’ copyrights. Anthropic Series G of $30 billion at a $380 billion valuation closed February 12, 2026, eleven days before the distillation blog post. Reported in Reuters, AP News, The Atlantic(March 2026), and the China Academy commentary.
- Volume math for the 150K observation. Comparison datasets: AM-Distill (a-m-team, “1.4 Million Open-Source Distilled Reasoning Dataset,” arXiv:19633, 2025); DeepDistill (Tian et al., “DeepDistill: Enhancing LLM Reasoning Capabilities via Large-Scale Difficulty-Graded Data Training,” arXiv:2504.17565, 2025: 3.34M queries × 40M responses); DeepSeek-R1 reasoning tokens (~4M samples) and QwQ-32B (1.2M) referenced in SmolLM3 mid-training documentation. Codeforces evaluation methodology from DeepSeek-AI V4 technical report §5.3.1 (Apr 2026): 32 candidate solutions per problem × 114 Division 1 problems collected May–November 2025 = 3,648 calls per model version per benchmark.
- GPT-5.5 token-efficiency claims. OpenAI launch announcement, “Introducing GPT-5.5,” April 23, 2026 (com/index/introducing-gpt-5–5): GPT-5.5 reportedly uses approximately 40% fewer output tokens than GPT-5.4 on Codex tasks at matched per-token latency. Vellum analysis (“Everything You Need to Know About GPT-5.5”) confirms the arithmetic — 2× sticker increase combined with 40% token reduction yields ~20% net cost increase per Codex task rather than 100%. The 72% reduction figure vs Claude Opus 4.7 on identical coding tasks comes from MindStudio’s third-party comparison (“GPT-5.5 vs Claude Opus 4.7: Real-World Coding Performance Compared”). Artificial Analysis externally corroborates a large reduction in output token usage relative to GPT-5.4 in evaluation settings. All three figures are scoped to coding workloads as of late April 2026; no published replication on RAG, extraction, classification, document analysis, or other enterprise non-coding workloads. The DeepSeek V4-Pro substack benchmark separately notes V4-Pro produces dense output (~4,200 output tokens vs Claude’s ~7,500–8,800), so any token-efficiency comparison should be against V4-Pro specifically, not against the verbose Anthropic baseline.
Disclosure & Methodology Notes
Snapshot Dates
The benchmark numbers in this piece reflect the DeepSeek V4 technical report (April 2026), the LM Arena leaderboard at arena.ai/leaderboard/text as of April 26, 2026, the Artificial Analysis Intelligence Index as of April 28, 2026, and vendor rate cards as of late April 2026. Frontier-model leaderboards drift weekly. Procurement decisions taken months after publication should re-verify the headline numbers against the current state of those sources.
No Vendor Relationships
I have no consulting, advisory, equity, or commercial relationship with any of the labs named in this piece — Anthropic, OpenAI, Google DeepMind, DeepSeek, Moonshot, Z.ai, MiniMax, xAI, Meta, or Mistral. No vendor has reviewed or commented on this draft.
Methodology
Benchmark scores are vendor-reported except where third-party harness runs (vals.ai, Vellum, MindStudio, Artificial Analysis) are cited explicitly. Pricing ratios use 1:1 input/output blended rates from published rate cards; batch and prompt-caching discounts are noted but not applied. Self-hosting total cost of ownership is deferred to Part 2 and not modeled here. Differences under approximately three benchmark points should be read as directional rather than precise, given that cells are not all reproduced under one uniform harness.