It’s not uncommon for enterprises looking for ways to harness the power of their data to come across data platform-native solutions like Databricks Lakehouse Monitoring. Whether it’s about gaining critical insights, driving impactful business decisions, mitigating risks, or ensuring compliance with regulatory requirements, a data platform drives organic success—where your data drives growth aligned to the right business outcomes.
But here’s the catch—the true secret to achieving organic success lies in data quality. High-quality data ensures that decisions are based on accurate, reliable, and consistent information, leading to better business outcomes and a competitive edge. Without clean, trustworthy data, even the most advanced AI models or business strategies are bound to fall short.
In this blog, we’ll uncover the critical aspects of data quality that drive organic success for data-driven teams. We’ll further explore how Databricks Lakehouse Monitoring supports comprehensive data quality and observability.
First, let’s uncover essential elements of a winning at data quality strategy and show why data quality is the foundation of success in the era of AI in analytics.
Here are the key attributes of data quality:
- Accuracy: Correct representation of real-world entities and events.
- Completeness: Identification and resolution of missing or incomplete data.
- Conformity: Adherence to specified formats and defined business standards.
- Consistency: Uniform representation of data across systems and datasets.
- Timeliness: Availability and currency of data when needed.
- Uniqueness: Absence of duplicate records within a dataset.
- Validity: Compliance of data values with acceptable ranges and formats.
In a business context, data observability and data quality are deeply interconnected, working together to ensure reliable and actionable data for organic success. Data quality focuses on the intrinsic attributes of data, such as accuracy, completeness, and validity, ensuring that the data meets predefined standards and is fit for purpose
On the other hand, data observability provides real-time data pipeline monitoring and visibility into processes and systems, enabling businesses to proactively detect and resolve issues that could compromise the quality of the data.
For example, observability tools can identify anomalies, schema changes, or data downtime, which might otherwise lead to incomplete or inaccurate datasets. By combining data quality measures with observability practices, businesses can establish a robust framework for managing their data assets.
Observability not only supports data quality by identifying and addressing issues in real time but also ensures that data remains reliable as it flows through complex systems. This synergy prevents disruptions, maintains trust in data, and maximizes value from data assets, ultimately driving better business outcomes.
How Does Databricks Lakehouse Monitoring Maintain High Data Quality and Observability?
Databricks Lakehouse Monitoring is an automated solution for tracking and maintaining data quality within Unity Catalog tables in a Lakehouse architecture. It ensures key data quality attributes like accuracy, consistency, and completeness are upheld, making it easier to trust and use data for analytics and machine learning workflows.
The Databricks data intelligence platform enables data teams—such as data analysts and ML engineers—to monitor data quality, consistency, and performance over time. It provides comprehensive data observability insights into metrics like statistical data, numerical profiling, and categorical summaries, helping teams identify and resolve issues quickly.
A useful feature is that data practitioners can set up custom monitoring profiles based on their use cases and visualize metrics through intuitive dashboards. The solution also includes a rich set of default quality metrics specifically for Delta tables in Unity Catalog workspaces, simplifying the process of maintaining high-quality data.
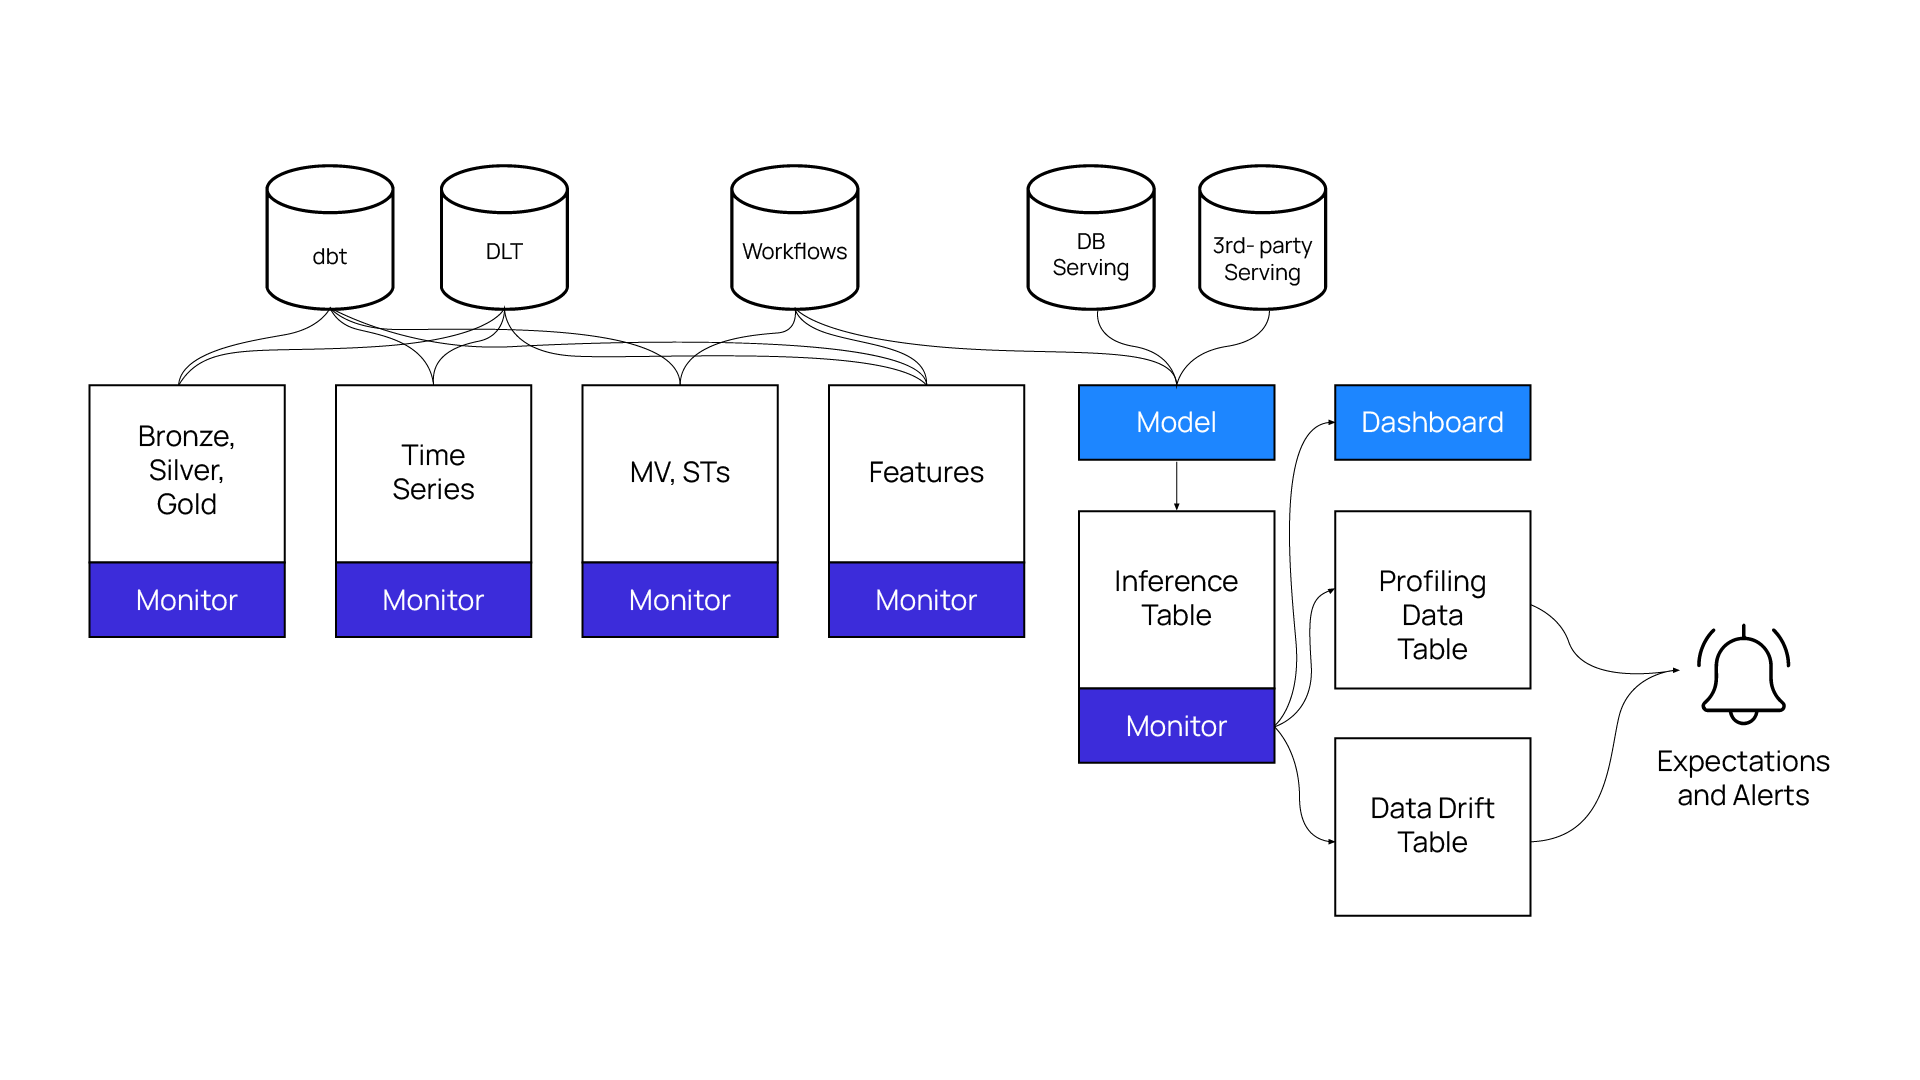
Lakehouse Monitoring Workflows: Profile, diagnose, and enforce quality for Unity Catalog table
A Few Prerequisites to Use Databricks Lakehouse Monitoring
The following are the requirements to use Databricks Lakehouse Monitoring:
- Make sure you’ve enabled Databricks premium tier-based Unity Catalog workspace. Learn how to set up your Unity Catalog workspace in our blog.
- Create SQL Serverless compute for monitoring workloads (default).
- Understand that Lakehouse monitoring supports only Delta table type—managed, external, views, streaming tables.
Note: Incremental processing is currently not supported for monitors based on streaming data pipelines. This means users must rely on full-batch processing for such monitoring workflows to ensure accurate data observability.
Understanding Your Databricks Lakehouse Monitoring Dashboard
Databricks Lakehouse Monitoring offers three types of analysis: time series, snapshot, and inference. For the snapshot profile type, it compares the actual data against a baseline sampling table that aligns with the business quality standards defined by the business team. This ensures that the data adheres to expected quality benchmarks over time.
Below is an example of a customer sales dashboard that showcases various data quality metrics and sales monitoring insights. These dashboards provide actionable intelligence by visualizing key metrics, helping teams maintain data integrity and monitor performance effectively.
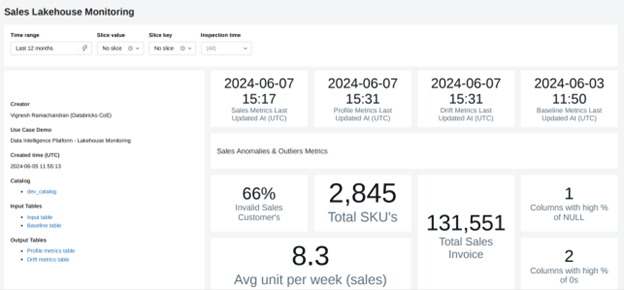
Sales Lakehouse Monitoring Dashboard: Displaying various metrics to identify outliers and anomalies
The Lakehouse Monitoring dashboard is a unified platform with various metric tables with pre-computed data quality metrics. This dashboard automatically generates and computes a wide range of metrics, such as statistical properties, numerical distributions, and categorical summaries, for Delta tables in the Unity Catalog.
These metrics are essential for identifying data anomalies and outliers based on the quality standards defined by the business team. This dashboard gives users complete visibility into their data and models, enabling them to monitor trends, detect issues, and ensure data quality over time. The metrics are stored in Delta tables, allowing for ad hoc analysis, custom visualizations, and even setting up alerts for proactive monitoring.
This automated approach simplifies maintaining high-quality data pipelines and ensures that data remains reliable for analytics and machine learning workflows. We can leverage the profile metrics & drift metrics table to maximize this data quality solution by understanding the actual deviation per metric against the standard baseline table.
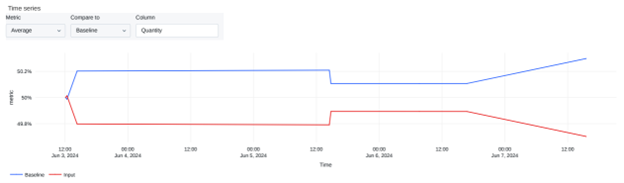
Baseline vs Input: Drift distribution over average quantity
The Lakehouse Monitoring dashboard integrates seamlessly with Databricks SQL alerts, allowing users to configure alerts based on SQL query results from metric tables, such as drift metrics or profile metrics. These alerts can be set up to monitor specific conditions, like when metrics deviate from expected thresholds, data distribution trends change, or drift occurs. For example, users can create an alert to trigger when a metric exceeds a predefined threshold, such as a Mean Absolute Percentage Error (MAPE) exceeding 0.1.
Additionally, these alerts can be extended to email notifications, ensuring that teams are promptly informed of any anomalies or threshold breaches. This capability enables proactive monitoring and quick responses to data quality issues, helping maintain the reliability of data pipelines and models.
Key Capabilities of the Lakehouse Monitoring Solution
- Unified Monitoring
Unified Monitoring allows teams to monitor their entire data pipelines, from raw data to machine learning models, using a single, unified platform. - Automatic Drift Detection
Automatic drift detection tracks the performance of machine learning models to identify and address issues such as model drift and performance degradation. - Comprehensive Monitoring & Notification
Comprehensive monitoring and notification provide automated alerts and root cause analysis, enabling quick identification and resolution of data and model quality issues, which minimizes downtime and maintains operational efficiency. - Improved Observability & Data Compliance
Improved observability and data compliance are achieved through continuous monitoring, which ensures compliance with data governance and regulatory requirements by maintaining data integrity and security. - Easy Identification of Data Anomalies & Outliers
Easy identification of data anomalies and outliers is supported by continuous monitoring, ensuring data accuracy, consistency, and completeness—crucial for reliable analytics and decision-making. - Enhanced Support for Multiple Visualization Chart Types
Enhanced support for multiple visualization chart types allows users to create custom dashboards to visualize key metrics and trends, tailored to their specific needs.
Accelerate AI Business Outcomes with Hexaware and Databricks: Your Unified Solution for Data/AI Quality and Observability
Hexaware, as a trusted service provider, partners with Databricks to deliver cutting-edge solutions for enterprises aiming to ensure data quality, maintain compliance, and optimize their data and AI pipelines. With Databricks Lakehouse Monitoring, you can gain access to unified monitoring, automatic drift detection, comprehensive notifications, and customizable visualizations. These features empower teams to proactively address data and model quality issues, simplifying operations and enhancing decisions for organic success.
Looking to learn more about the features of Databricks Lakehouse Monitoring? Check out Databricks’ solution guide here.