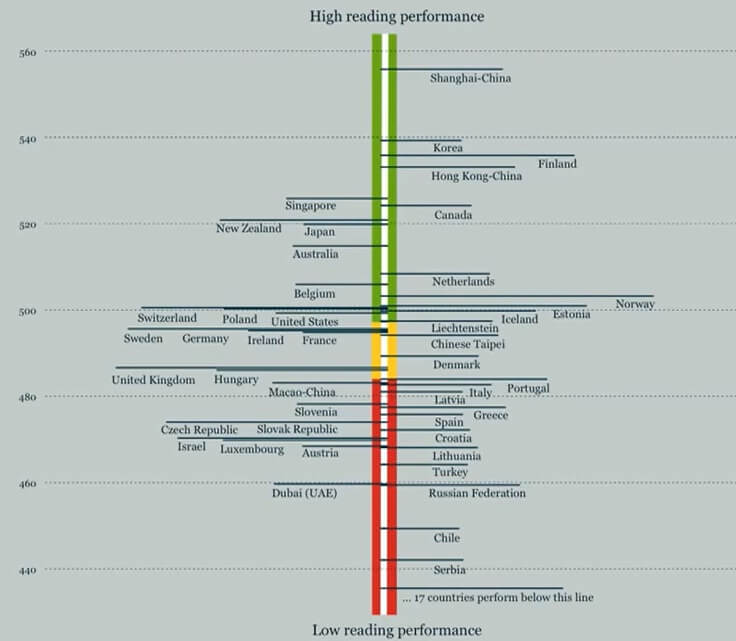
The TEDGlobal 2012, conference was of great significance to the World of Education as Andreas Schleicher – A German statistician and researcher in the field of education introduced the PISA (Program for International Student Assessment) test. PISA assesses student’s understanding (Mathematical, Scientific and Reading skills) and their ability to apply the concepts in day-to-day life. The results of PISA findings were quite alarming – Shanghai topped the chart with Serbia at the bare bottom in terms of Student’s reading performance.
 f
f
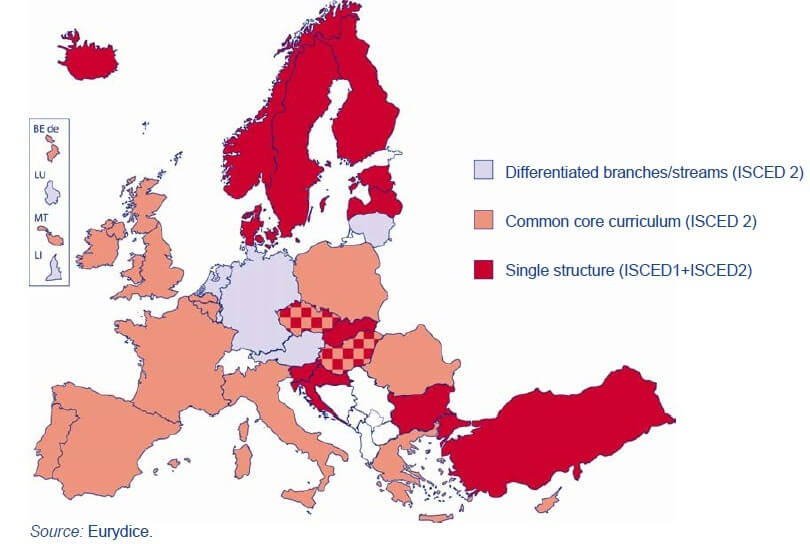
Also if one would notice from the above chart countries that follow similar organizational models of education; For instance countries in Europe had different scores!!! The primary and lower secondary education of Europe falls under International Standard Classification of Education (ISCED) Level 1 or 2 – 2010/2011

| ISCED Level | Description |
|---|---|
| 1 – Primary Education | Programmes typically designed to provide students with fundamental skills in reading, writing and mathematics and to establish a solid foundation for learning. |
| 2 – Lower secondary education | Designed to complete basic education, usually on a more subject-oriented pattern. It builds upon the learning outcomes from primary education (ISCED level 1) and aims to lay the foundation for lifelong learning and human development. |
Courtesy: Wikepedia

Education industry is one sector where information is collected in an organized manner this makes application of analytics all the more easier but the challenge is how the intelligence is transformed into implementation. For education analytics to bring in transformation data awareness needs to be created at institutional and board levels.
As with any analytics process the key steps are:- 1) Data Collection, 2) Analytical Analysis 3) Model creation with key data factors. However the first two steps are at an institutional level while the third step needs to be institutionalized at an education board level
Data Collection – Institutional Level
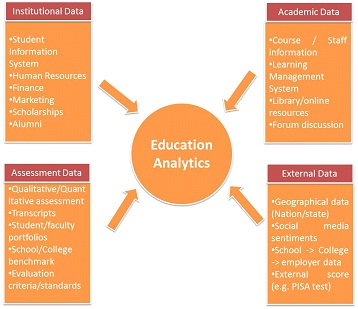
For a transformative analytics program, the data elements captured should be beyond those that are in a student report card. The below figure is a representation of the different data elements that are critical for an education analytics initiative:

As depicted in the above illustration it is important to collect data elements from different perspectives:
- Institutional Data – To analyze the school/college operational aspects
- Academic Data – To analyze the curriculum, delivery aspects
- Assessment Data – To analyze the examination, evaluation aspects
- External Data – To analyze school/college performance vs. external education ecosystem
Analytical Analysis – Institutional Level
Analytics on a broader scale is all about reporting (rear-view), predicting (forward) and prescriptive (suggestive). However when applied to the field of education there are three main categories – Academic, Learning, Predictive Analytics.
| Analytics Category | Description | Target Group | Real World Examples |
|---|---|---|---|
| Academic | Process that facilitates analysis of institutional data to arrive at decisions w.r.t operational and financial aspects | Institution – School/College | M Reports – University of Michigan |
| Learning | Process that facilitates analysis of course, curriculum, student, faculty data and arrive at decisions w.r.t training, assessments | – Department – Students – Teachers |
Check My Activity – University of Maryland, Baltimore County |
| Predictive (applicable to academic and learning) | Application of statistical techniques on data to identify patterns, associations to forecast an outcome | Students | Student Success Plan – Sinclair Community College |
Application of these different levels of Analytics is indispensible to get a larger picture of the problem/opportunities in place.
Model Creation with Key Data Factors – Educational Board Level
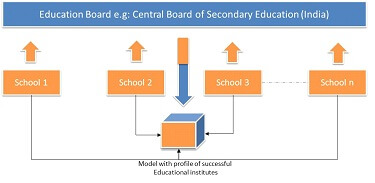
The ideal state of education analytics is not merely to gather data and analyze history, but build a model that will elevate the state of education. This is possible only when the data elements that are collected at an institutional level are analyzed at a board level so that a boarded picture of the system is obtained, the below image summarizes this approach:

The model will have a profile (e.g. size of classroom, teacher qualification and salary, profile of parents etc..) of successful education systems/institutes published and recommended for adoption by other institutes thereby enabling a cohesive educational ecosystem.


