COVID-19 Workforce Dashboard – Responsive Workforce Engagement
Data & Analytics
May 8, 2020
Impact of COVID-19 pandemic is unprecedented for our times and affected human life in all possible ways. Businesses are no exception to this disaster and business leaders are grappling with difficult ‘respond’ and ‘recovery’ strategy questions.
In the ‘response’ strategy of COVID, listed below are the key focus areas enterprises are pursuing:
- Workforce management
- Supply chain stabilization
- Customer engagement
For all these focus areas, it is paramount to have COVID intelligence that tracks COVID spread in different regions on a day-to-day basis. By combining this COVID live data with enterprise-specific stakeholder data such as workforce physical location and health status, customers’ location and their transaction details, suppliers’ location and stock details, management can derive key insights to ensure business continuity.
Of these focus areas, “Workforce Management” is the top priority for all the businesses. This is mainly because of its relevance to post-COVID, medium to long term ‘transform’ strategy of business.
“Around 70% of the organisations believe that the single biggest concern for continued remote working is fall in productivity.” source
“Only 22% organizations are thinking about manpower optimization in the short term, while 35% organizations want to look at optimization in the future basis business impact and in line with the newer ways of working.” source
COVID crisis management and BCP response teams were formed to manage this crisis. With respect to Workforce management during COVID, the key challenges faced by the Business leaders and Chief People Officers (CPO) include:
- How do I ensure the safety of my employees during this time?
- How do I keep employees engaged and connected throughout the crisis period?
- How to effectively manage remote workforce to ensure business continuity?
However, lack of a single source of truth and a consolidated view of COVID impact integrated with employee data is hindering leaders to manage this problem effectively.
Hexaware has come up with simple, flexible, dynamic & ready-to deploy Dashboards to enable enterprises to run their operations efficiently through effective workforce management.
Dashboards are integrated with live COVID intelligence that are sourced from different public sources such as government websites and regulatory organizations. The dashboard has COVID data at country level for all the countries in the world and at state/county level for selected key countries. By combining this data with employees’ details such as physical location, health (voluntary, self –declaration), age and department, the dashboards will convey deep and useful insights for the management to ensure the safety of their employees.
Based on the prediction from current COVID trends, BCP teams can proactively plan for staggered work schedules and alternate work options. Hexaware’s innovative dashboard solutions help organization enable their employees by providing adequate resources (laptops, network dongles etc.) to ensure continuity of business. Organizations can also mobilize medical support if required.
In a comprehensive way, the Dashboard answers following key Business questions:
- How to get a comprehensive view of employees’ geographical distribution to plan for distributed teams
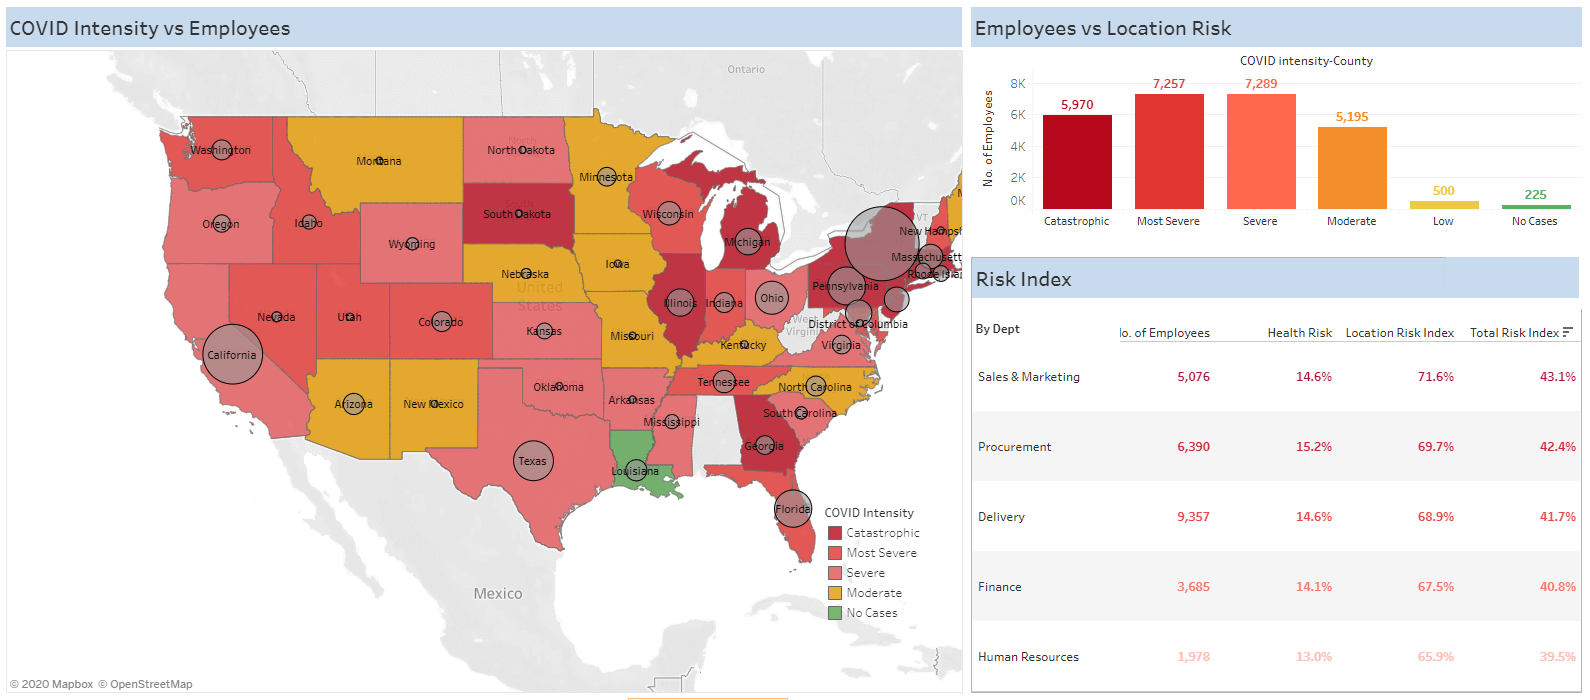
- What % of employees live in risky locations
- What are the higher risk departments/business units to immediately focus on to ensure Business continuity
- How can I quickly access the list of employees with different risk exposures to ensure adequate support is provided in critical areas (Medical, Remote enablement and other support needs)
- Engagement with employees with varied COVID infection risks
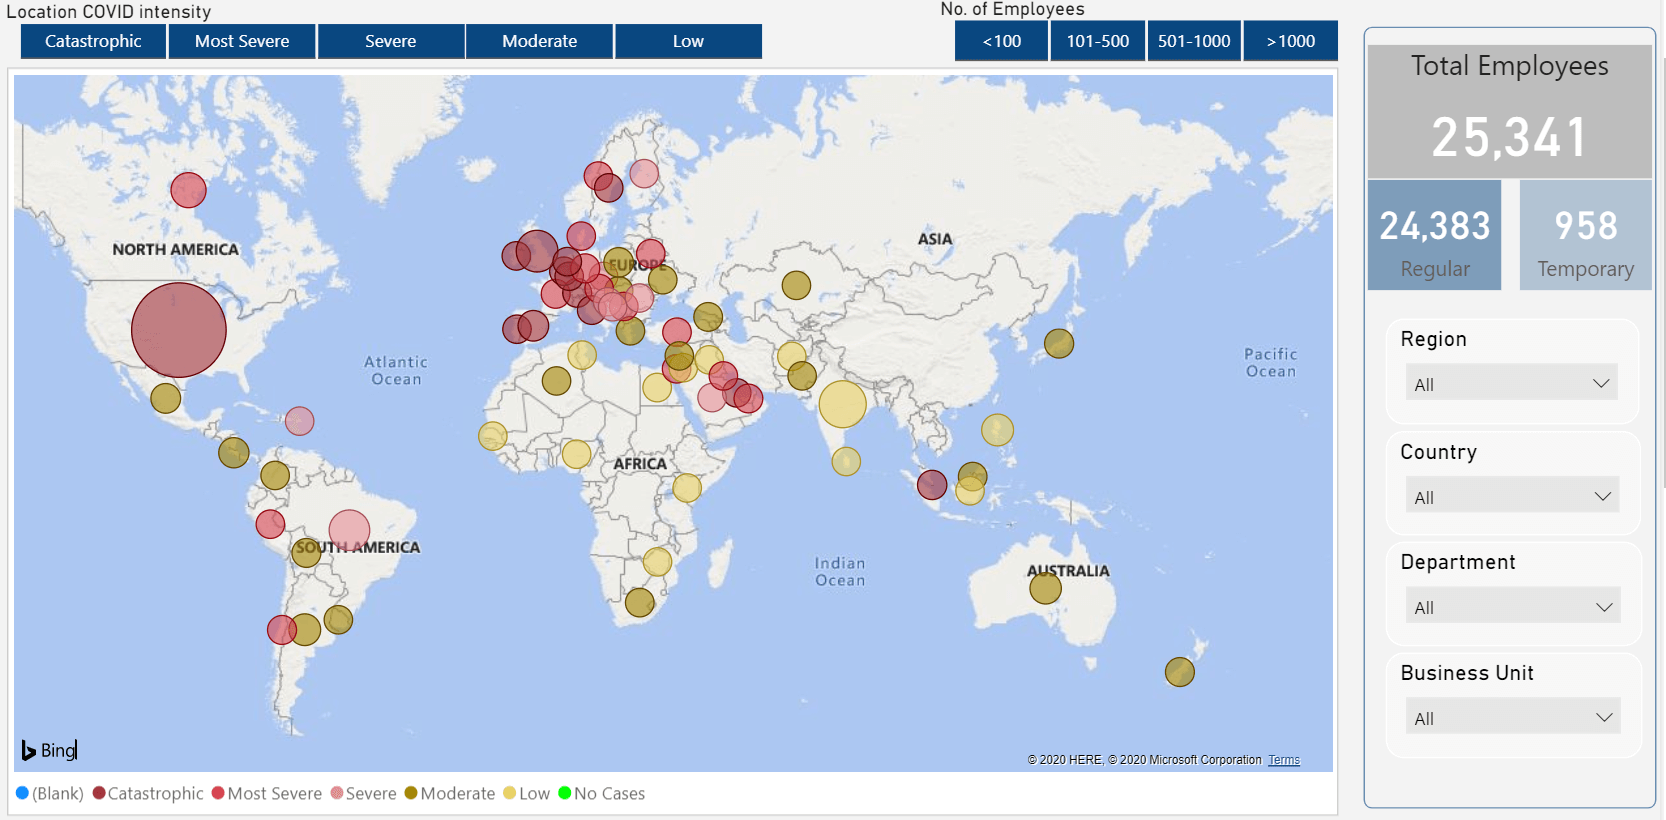
Employee distribution vs COVID intensity – Live dashboard snapshots
Each country/state/county is colour-labelled based on its respective confirmed cases relative to the population & size of the circle indicates the no. of employees in the region. Users can drill down to Country -> State -> County level to get deeper insights.
This framework can be extended to cover other key stakeholder-specific use cases as well i.e., Suppliers and Customers. By integrating suppliers/customers’ data with COVID live Data, insightful dashboards can be generated for Business Management.
Kindly reach us at marketing@hexaware.com for a quick solution demo and for thoughts on how to enable COVID dashboard within 2 to 3 days.
About the Author

Read more
![]()


Related Blogs

Enterprise Data Services: The Backbone of Modern Businesses
- Data & Analytics

Navigating Databricks’ Delta Lake Features and Type Widening
- Data & Analytics

Top 13 Data Science Services Providers: Bridging the Gap Between Data Capabilities and AI Strategy
- Data & Analytics


The Role of AI in Automating SAS to PySpark Conversion and Accelerating Data Migration
- Data & Analytics

How to Achieve New Standards in Data Quality and Observability using Databricks Lakehouse Monitoring
- Data & Analytics


Retrieval-Augmented Generation (RAG) on Amazon Bedrock
- Data & Analytics

Databricks Unity Catalog for Comprehensive Data Governance
- Data & Analytics

Ready to Pursue Opportunity?
Every outcome starts with a conversation
