Have you ever come across a situation where a report is demanded by the client in excel which requires heavy formatting? Preparation of such a report from PeopleSoft can become a daunting task if a right approach is not followed. If you are ever in such a situation, how do you approach it?
Let me take a scenario and provide a guided path to the solution.
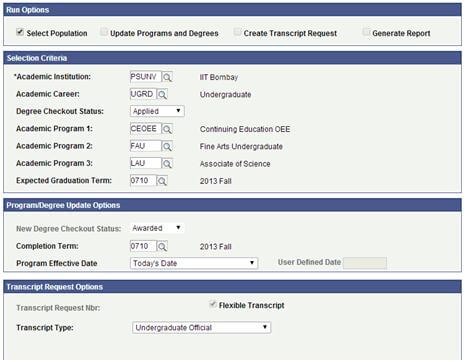
Campus solutions support preparation of a select section of students who have applied for graduation. It’s achieved by providing a selection criteria and then fetching the results.


Once the candidates are selected the objective is to award them the degree at a convocation event. Convocation in a university is quite a formal affair which is attended by students, faculty, dignitaries etc. Lots of people need to seat in an auditorium, all in perfect order. The event can be better managed if all the seats are pre-allotted especially when the participation is huge. (Business process can be written to assign seats to graduating students)

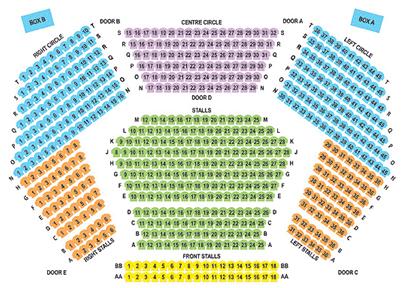
To make the seating arrangement seamless, it is prudent to have a pictorial view of the seats or a Seat-map. The map will give a view of each seat with a color code depending on whether it is occupied by Student receiving a degree, Student receiving an award, Faculties, Dignitaries, Reserved or Vacant seats. The map is quite handy for the event manager or admin.

The obvious choice to display this info is excel since size of the cells can be shrunk as desired to view the entire population and also colors can be easily adjusted. The challenge lies in the preparation of this report. (Screen below for reference)
Legend for Seat Map:
S – Student for degree
A – Student for Awards
T – Team leader/Faculty for department
R – Reserved for dignitaries
B – Vacant seats

So how does one go about using Excel to prepare such a complicated looking seat-map? There are two ways of approaching this.
The easier way out is to write a macro in excel (VB code) to convert the seat allocation data in the required format, prepare an excel add-in from the macro and make it available in website. The end user has to download the data as well as the add-in, install the add-in in a system and finally run the same to get the report. This was actually the way we implemented it for one of the premier institute in India. The total time needed to prepare the macro was not more than a day. However, not many clients would agree to this 3 step process. Many would like to have the luxury of simply clicking a button and getting the report generated.
Fortunately, there is another way. First we will take only a sub-set of the data which needs to be generated. It should cover all the relevant cases i.e. all the different color codes and the legend. Refer to the screen below. (Note that each cell also has a comment tag which stores the name/id of the person occupying the seat.)\

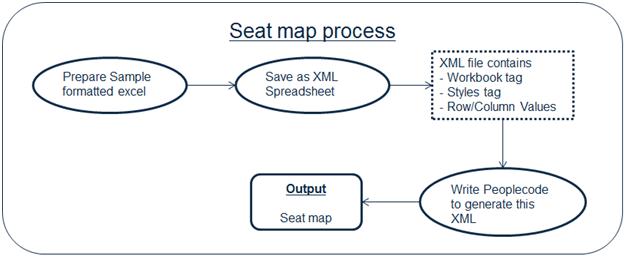
Once we have identified a subset containing all cases, the next step is to manually prepare a new excel with this data and format.From the ‘Save As’ option of excel, save the file as ‘XML spreadsheet’. This saved file has the extension as ‘.xml’ but it can be opened from excel with all the formatting intact. The objective is to generate this xml file from Peoplecode by studying the manually generated file. Let’s us now understand the xml (file included for reference) which is primarily divided into 3 parts.
- Attributes and values of the Workbook tag – These are some default values of workbook and can be directly copied / pasted in the peoplecode. No modification is necessary.
- Attributes and values of the Styles tag – These are static values which stores formatting information used throughout and assign a unique id to different styles. It can be copied to the code straightaway, no modification necessary.
- Attributes and values for Rows/Cells – These are the only tags which are to be dynamically generated from peoplecode as they contain the actual data displayed in excel. The Row and cell have a parent-sibling relationship and each cell is assigned a style ID from the styles tag. Write code to fetch and format data so that all the rows required in excel can be generated. A cursory look at the file will make the schema very clear and it can be quickly generated using basic loops.

All it takes is a click of a button for the end user to generate and view the xml as a formatted spreadsheet. The saved file even has an excel icon and is opened in excel by default, obscuring all the nitty-gritties.
A colleague of mine also pointed out that charts, graphs and this kind of reports can also be generated via xml publisher by preparing an xmlp file but that is for another day of research.


